News & Insights
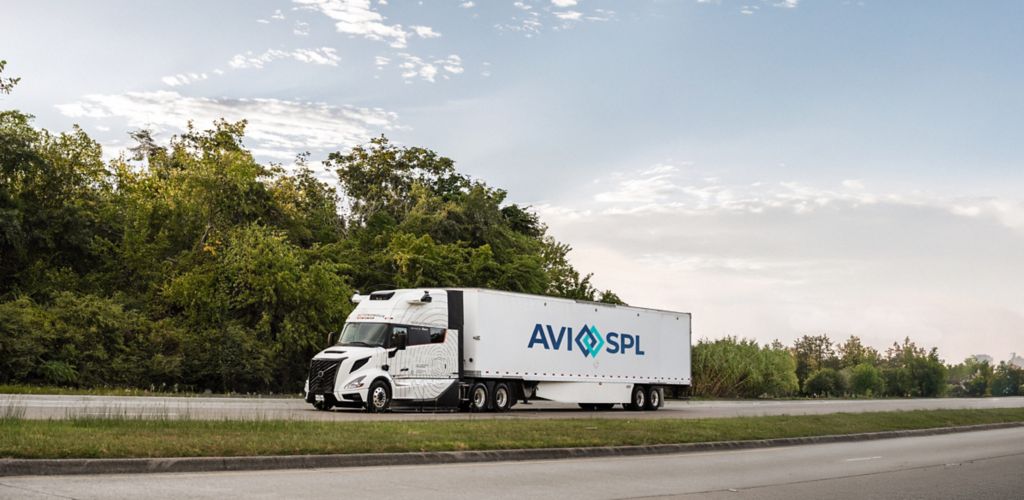
Volvo Starts Autonomous Commercial Freight Route in Texas
Volvo Autonomous Solutions, a division of Volvo Group, has begun an autonomous commercial freight operations route in Texas in partnership with tech company AVI-SPL, it announced recently (press release. What’s next: Volvo Autonomous Solutions, which plans to go completely driverless on U.S. highways by the first quarter of 2027, said it expects to be running …

NAM, Coalition Members to House: Pass the PACK Act
The Packaging and Claims Knowledge (PACK) Act would help keep consumers informed about what types of product packaging are recyclable, compostable and reusable while avoiding a harmful patchwork of state regulations—and Congress should pass it, the NAM and its coalition partners
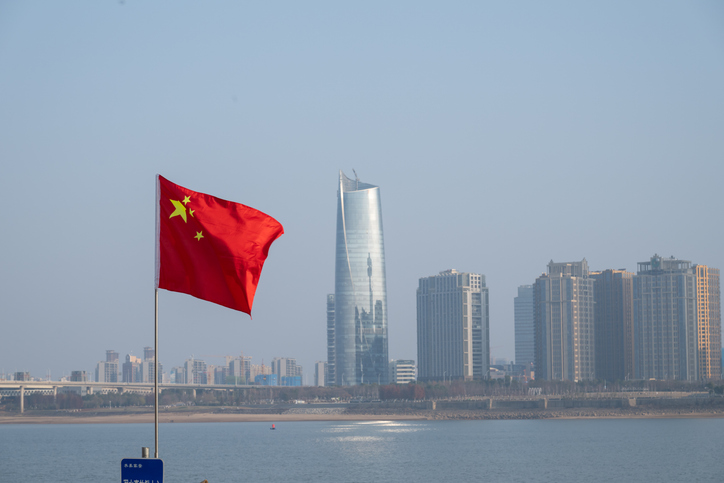
Study: China’s Export Controls Could Threaten $6.5 Trillion
Beijing’s rare earths export controls could put $6.5 trillion in downstream, non-Chinese production at risk, according to the International Energy Agency (Global Critical Minerals Outlook 2026, the IEA said the curbs put in place last fall, which Chinese President Xi Jinping postponed for a year in October, could threaten production across the automotive, high-tech, defense …

Manufacturers: Food Labeling Bill Would Increase Costs, Uncertainty
A new food labeling bill would increase costs for Americans without providing valuable, scientifically substantiated nutritional information. Manufacturers are urging policymakers to reject this measure, as the NAM said NAM Executive Vice President Erin Streeter in a statement.
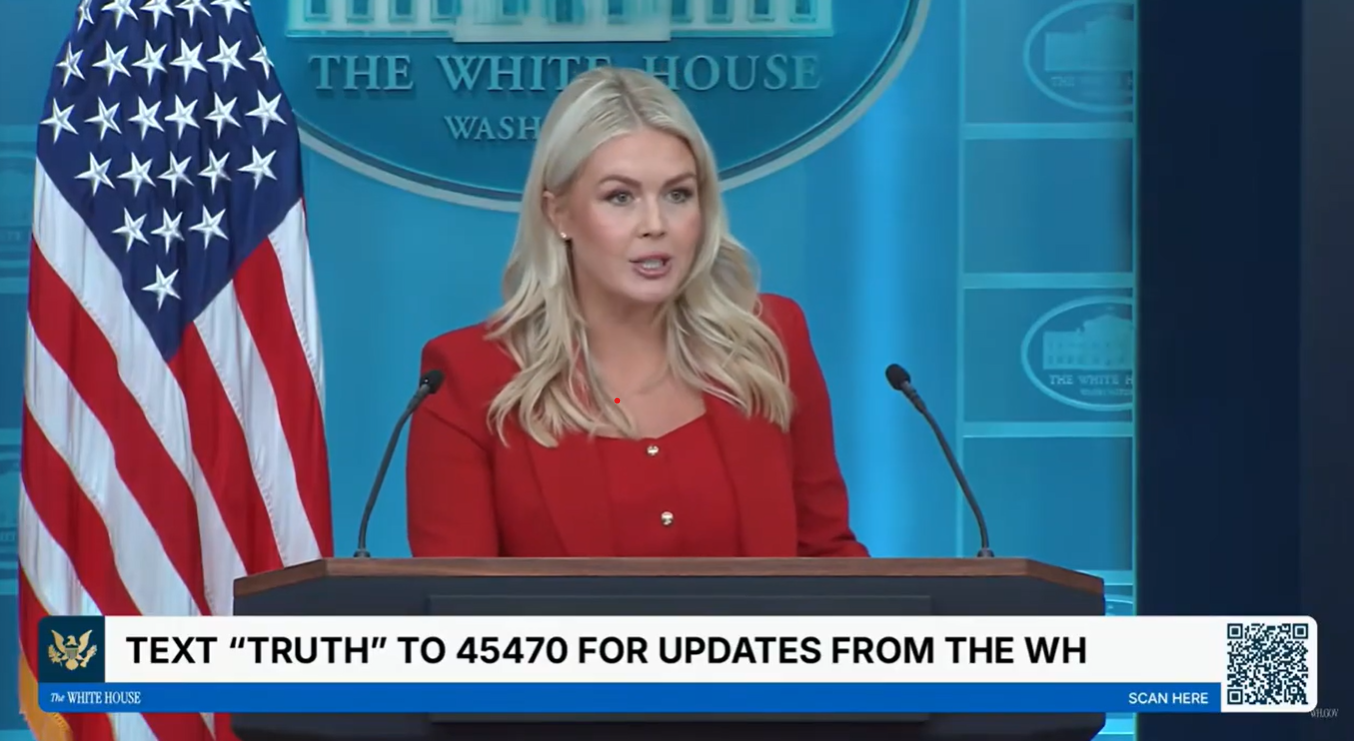
White House Spotlights NAM Tax Wins at Press Briefing Today
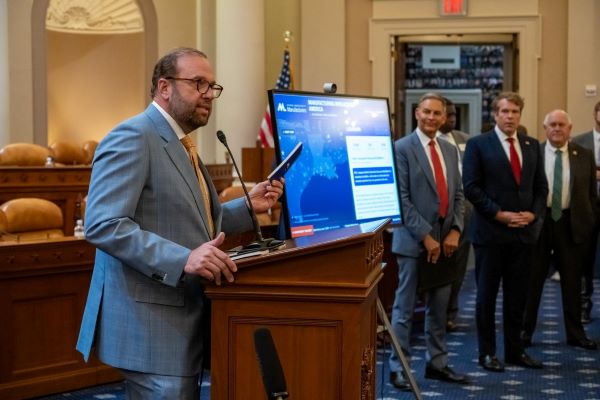
White House Press Secretary Karoline Leavitt Manufacturing Tax Wins Across America flipbook. The stories: From the White House podium, Leavitt highlighted several of the manufacturers featured in the NAM’s story collection: Pro-growth policy: Leavitt emphasized that the stories demonstrate how pro-growth tax policy translates into greater opportunity for manufacturers, workers and communities. The bottom line: …
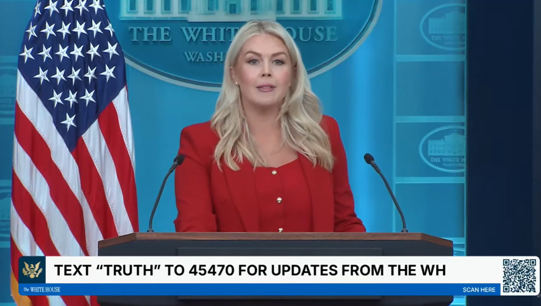
ICYMI: Karoline Leavitt Talks Manufacturing Success Stories, Cites NAM During White House Press Briefing
Washington, D.C. – White House Press Secretary Karoline Leavitt celebrated the pro-growth impacts of the Working Families Tax Cuts today in her press briefing. She cited the National Association of Manufacturers’ “
NAM to SEC: Filer Status Simplification a Win for Small Manufacturers
The Securities and Exchange Commission’s recently proposed rule to lessen disclosure burdens for small and mid-cap companies would bring relief to many manufacturers and should be finalized, the NAM
NAM, Allies Nationwide: Reauthorize the EXIM Bank
The NAM and U.S. Chamber of Commerce co-led a Inside U.S. Trade (subscription) covered the effort, which featured more than 300 organizations from all 50 states. What’s going on: As America’s official credit agency, EXIM helps level the playing field for American exporters and manufacturers competing in markets where “foreign competitors are aggressively deploying state-backed …
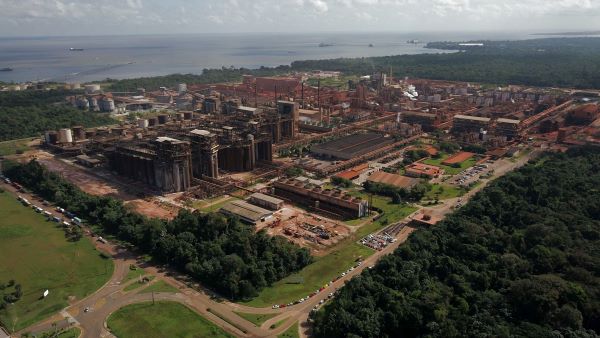
Why Manufacturers in America Need Aluminum Hydroxide
Aluminum hydroxide—a chemical used in everything from defense industrial base manufacturing to oil and gas refining and the production of liquefied natural gas and petrochemicals—is one of the most important and least-known workhorses of the manufacturing industry. That’s why protecting America’s supply is so important—especially since it cannot be produced here in sufficient quantities. Many …
Tax Wins Across America Takes Capitol Hill at NAM-Hosted Event
Over the past year, the NAM and manufacturers across the country have hosted members of Congress, White House Cabinet officials, state and local officials and community leaders at their facilities to show how H.R. 1 has given them the confidence to invest in their people, purchase new equipment and plan confidently for the long term. …