Industrial Production Ticks Up as Manufacturing Capacity Utilization Edges Higher
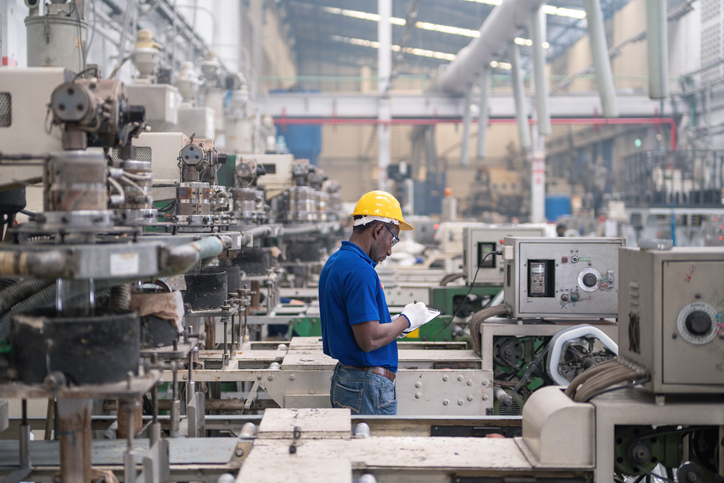
Industrial production ticked up 0.2% in July, while manufacturing output rose by a similar amount after increasing 0.3% in June. At 98.4% of its 2017 average, manufacturing production moved up 1.2% from July 2025. Capacity utilization for manufacturing was 76.0%, up slightly from 75.9% in June and up 1.0% over the past year. Capacity utilization remained 2.3 percentage points below its long-term average from 1972 to 2025.
In July, production for market groups posted mixed results. Consumer goods production edged down 0.4%, while business equipment output increased 0.8%. The decline in consumer durables (down 1.4%) was led by the output of automotive products falling 2.3%. Meanwhile, led by a drop in the index for clothing (down 2.1%), the index for consumer nondurables ticked down 0.1%. Among business equipment, a 1.5% increase in the output of information processing equipment led the gain. At the same time, the index for materials stepped up 0.3%, while the index for construction supplies moved up 0.8% and the index for business supplies stayed the same.
Durable goods manufacturing rose 0.7% in July and increased 3.9% from the year prior. In July, the largest monthly gain occurred in wood products (up 2.4%), while motor vehicles and parts manufacturing posted the largest loss (down 2.1%). Meanwhile, led by a 2.5% drop in printing and support, nondurable goods manufacturing moved down 0.4% in July and 1.6% from July 2025.