
EXIM Bank Leaders, Rep. Young Kim Spotlight Support for Manufacturers
The U.S. Export-Import Bank is a vital tool for strengthening America’s manufacturing economy—helping finance U.S. exports and giving small and medium-sized manufacturers a level playing field in export markets around the world. But without action from Congress, EXIM Bank’s financing authority will expire at the end of 2026.
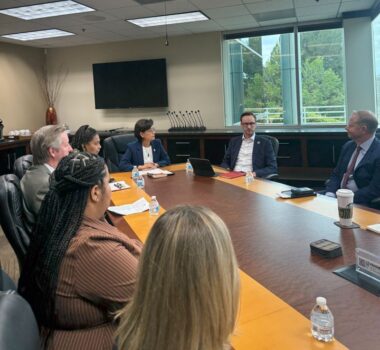
To spotlight EXIM’s impact, Rep. Young Kim (R-CA) hosted a roundtable with EXIM Bank leadership, the NAM, local businesses and manufacturers in her Southern California district to highlight how the agency helps companies expand, create jobs and win in the global marketplace.
What they’re saying: The roundtable gave EXIM leaders a chance to hear directly from the small businesses and manufacturers that rely on the agency’s financing tools to compete globally.
- “This valuable opportunity to convene with Orange County small businesses and regional stakeholders allows EXIM to directly hear about the challenges and opportunities they face to compete in global markets. Their insights ensure EXIM continues to provide financing tools and resources needed to unlock capital, grow their businesses and support jobs,” said EXIM Deputy Chief of Staff Thad Brock.
- “A long-term reauthorization of EXIM is critical to giving these businesses the certainty and support they need to expand into new markets and continue driving American economic strength.”
The NAM says: “The manufacturers we heard from today are exactly who the Export-Import Bank was built to serve—innovative, export-ready companies that need a level playing field to compete and win in the global marketplace,” said NAM Executive Vice President Erin Streeter.
- “EXIM provides valuable tools and resources that help local businesses expand, create jobs and reach new customers around the world. Southern California’s manufacturing sector is a testament to what American industry can do, and a long-term reauthorization of EXIM is crucial to ensuring these companies have the support they need to keep growing and competing globally.”
EXIM amplified the roundtable on social media.
NAM advocacy: The NAM continues to support long-term reauthorization of the EXIM Bank. In February, the NAM voiced support for the introduction of bipartisan legislation from Sens. Kevin Cramer (R-ND) and Mark Warner (D-VA) to reauthorize the export credit agency for 10 years. In March, the NAM urged both the House Financial Services Committee and Senate Banking Committee to advance a 10-year reauthorization, giving manufacturers the stability and certainty they need to compete globally.
NAM to DOL: Reconsider H-1B Wage Rule Proposal

A recently proposed Department of Labor rule that would require employers to pay H-1B visa holders and other employment-based immigrants higher wages “would materially weaken the industry’s efforts to deliver on the president’s vision for long-term, innovation-driven manufacturing growth and onshoring,” the NAM said this week.
What’s going on: In March, the DOL’s Employment and Training Administration put forth a proposed rule to raise the floor for the four wage levels that employers must offer (or exceed) to high-skilled immigrant visa holders.
- The proposal’s aim: “[T]o strengthen program integrity by reducing the incentive for employers to use these programs to replace, rather than supplement, U.S. workers by employing lower-paid alien workers,” according to the draft’s summary in the Federal Register.
- However, “manufacturers dispute the [Notice of Proposed Rulemaking’s] contention that foreign workers are hired at lower wages that depress those of their U.S. peers,” the NAM told the DOL on Tuesday.
Why it’s problematic: Requiring employers to pay the significantly increased wages mandated in the draft rule would have ill effects for the entire economy, the NAM told the agency.
- The proposal suffers from several flaws: It’s based on obsolete data, it contradicts the definition of “entry level” by setting a wage floor that excludes entry-level employees, and it does not take into account non-salary compensation.
- It would impair manufacturing—which has long suffered from a workforce shortage—by reducing access to highly skilled immigrant talent, burdening the sector with undue (and underestimated) compliance and wage costs and failing to offer a realistic phase-in period.
What should be done: The department should reconsider the proposed rule and consider alternative actions to realign U.S. immigration policy with the workforce needs of manufacturers, such as:
- Reserving part of the H-1B cap;
- Enhancing the H-1B selection odds; and
- Adapting the calculation of the prevailing wage levels for H-1B and [permanent labor certification] applications.
EVelution Energy to Build First Commercial-Scale Cobalt Processing Facility in U.S.

What’s going on: “The project is planned near the Wellton, [Arizona] area, where the company says early site work is already underway. The facility would process cobalt used in electric vehicle batteries, defense systems and other advanced technologies.”
- Most of the cobalt metal and cobalt sulfate produced by the facility will go to Japanese conglomerate Mitsui, with which EVelution last month signed a long-term offtake agreement valued at about $850 million over five years (EVelutionenergy.com).
- Construction of the facility is expected to begin next year, according to EVelution.
Why it’s important: The U.S. has no commercial-scale cobalt refineries, and cobalt is on both the U.S. Geological Survey’s Critical Minerals List and the Department of Energy’s Critical Materials List.
- The administration has made domestic production and processing of critical minerals a top priority, and the White House last week posted a news clip about the coming facility.
- “According to the company, studies by Baker Tilly estimate the project could create about 3,300 indirect jobs and generate more than $750 million in economic development for Yuma County,” according to KYMA.
The NAM’s take: Plans for the Arizona facility are in keeping with the NAM’s 2026 comprehensive critical minerals strategy, which it shared with the U.S. Trade Representative earlier this year.
- “The NAM strongly supports the administration’s efforts to reshape and rebalance global critical minerals supply chains through comprehensive actions domestically and with international partners,” the NAM says in its two-pronged framework, which entails specific work on both the domestic and international fronts, including permitting reform and the negotiation of a plurilateral agreement.
- “The comprehensive approach … effectively rebalance[s] the global market for critical minerals,” NAM President and CEO Jay Timmons said.
FERC Looks to Broaden Blanket Certificate Program for Gas Projects

What’s going on: In a unanimous vote last Thursday, FERC commissioners “introduced a notice of proposed rulemaking for the [blanket certificate] program that would roughly double its cost caps for types of blanket certificate projects.”
- The program, introduced in 1982, offers “an administratively efficient means to enable a company to construct, modify, acquire, operate and abandon a limited set of natural gas facilities,” according to the FERC website.
- The program’s last substantive changes were made in 2006.
What it means: The cap raising will align limits with “long-standing expectations for the scale of projects that are appropriate for the blanket program” and “further streamline our permitting processes and speed up construction that Americans depend upon for affordable and reliable energy,” FERC Chair Laura Swett said.
- The changes “would also expand the categories of projects eligible for streamlined authorization and extend the blanket certificate framework toward LNG facilities for the first time” (National Law Review).
Deadline extension: Also last week, FERC extended by a year the deadline for projects using temporary regulatory waivers on cost limits, pushing it back to May 2028.
Follow up: This month’s revisions introduction comes less than a year after FERC issued a notice seeking public comment on whether it should permanently change the cost thresholds for projects authorized under the blanket certificate program.
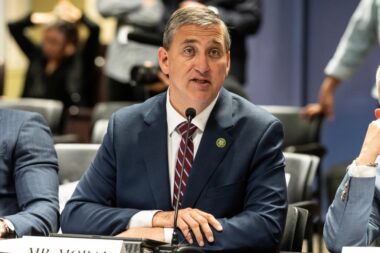
Rep. Moran on the Importance of Overtime Tax Deduction
As the NAM marks nearly one year since manufacturers secured a major tax victory in Congress, we continue to spotlight the lawmakers who championed this landmark legislation and provisions that are already making a difference.
Why it matters: “Manufacturing workers are some of the hardest-working people in this country, and they’ve long understood that overtime isn’t a bonus—it’s how they keep the line running, meet a contract deadline or respond to a surge in demand,” said Rep. Moran.
- Under the Working Families Tax Cuts, “manufacturing workers can now deduct the premium portion of their overtime pay—the ‘half’ in time-and-a-half—from their federal taxable income,” he explained. “So, if a worker earns $24 an hour and works 10 hours of overtime a week, that’s $12 per hour in deductible premium.”
- “Over 50 weeks, that’s $6,000 removed from their taxable income. For a worker in the 22% bracket, that translates to roughly $1,300 in federal tax savings for the year—more than $100 extra in their pocket every single month.”
The workforce angle: Rep. Moran also emphasized the importance of this deduction for recruiting and retaining manufacturing employees—and by extension filling the persistent talent gap in the sector.
- Thanks to this provision, “a manufacturer doesn’t have to raise the hourly overtime rate to make overtime more attractive—Congress has effectively increased the after-tax value of every overtime hour already being paid,” he said. “For a plant manager trying to fill a second shift or retain a skilled operator who’s being recruited by a competitor, that’s a meaningful talking point.”
- “In East Texas, I’ve heard from manufacturers who are already incorporating this into their recruiting conversations,” he added. “Employers are seeing a renewed interest in overtime-heavy roles that used to be harder to fill.”
What manufacturers should do: When asked what companies should do to benefit from the overtime deduction, Rep. Moran said, “Most importantly, tell your workers. … Put it on the bulletin board, mention it at the shift meeting, work it into your onboarding conversations.”
- “A lot of workers won’t learn about this deduction until they sit down to file their taxes—and by then, they’ve already missed months of planning around it,” he continued.
- “And make sure to document the impact,” he added. “When the time comes to debate whether to extend this provision beyond 2028, the strongest argument Congress can make is a real one. If your employees are benefiting, capture that story. Share it with your association, share it with your team, share it with my office. That kind of evidence is what moves legislation.”
Dive deeper: Check out the full Q&A here.
FAME Adds Six New Chapters, Bolsters AI Skills Development
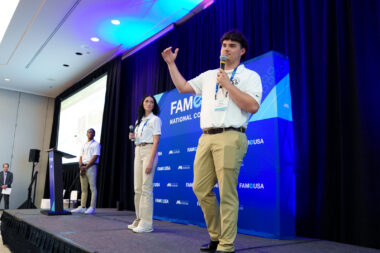
The Manufacturing Institute’s Federation for Advanced Manufacturing Education (FAME) program—the global-best workforce development program—announced the addition of six new chapters, funded by its inaugural FAME Catalyst Grants. The new chapters will be part of the MI’s new AI Skills Initiative.
The background: Founded by Toyota and led by the MI (the NAM’s workforce development and education affiliate) since 2019, FAME offers earn-and-learn apprenticeship programs that train the next generation of manufacturing talent.
- New FAME chapters are founded when local manufacturers partner with industry or economic development organizations and community colleges or technical schools.
The grants: The MI Catalyst Grants offer $50,000 in early-stage support to the sponsoring economic development organizations to fund staff time and travel involved in starting a FAME chapter.
- In total, the first grants amount to $300,000 in funding that will not only help manufacturers develop the skilled talent they need but also help students start lifelong careers in manufacturing.
- Google.org provided funding for the MI’s AI Skills Initiative, recently announcing $10 million in funding for the MI to support AI skills development in the manufacturing workforce.
The new chapters: The six inaugural recipients are:
- East County Economic Development Council in El Cajon, California;
- Carroll Tomorrow in Carrollton, Georgia;
- One Acadiana in Lafayette, Louisiana;
- Hinds County Economic Development Authority in Jackson, Mississippi;
- Greater St. Cloud in St. Cloud, Minnesota; and
- Big Country Manufacturing Alliance in Abilene, Texas.
Next steps: After building a coalition of local manufacturers along with a community college partner to support FAME chapter development, the recipients will enter the FAME Academy by October 2026 to learn how to manage the FAME Advanced Maintenance Technician program to deliver global-best results.
- Their first cohorts of students will be selected for employment at their selected company in spring 2027 and begin training and classes in fall 2027.
The big expansion: Thanks to the addition of these six new chapters, FAME’s total reach will expand to 52 chapters in 19 states. The Minnesota and Georgia chapters will be the first in their respective states.
The MI says: “With six new chapters getting off the ground—and more to follow—FAME is spanning the skills gap and providing manufacturers a workforce solution that meets the needs of today and tomorrow,” said MI President Carolyn Lee.
- “The interest we’ve seen from manufacturers and economic development organizations across the country demonstrates the success of the model. This is just the beginning,” added FAME National Director Tony Davis.
Biogen’s Nicole Murphy Aims to Elevate the Manufacturing Workforce

Biogen Executive Vice President and Head of Pharmaceutical Operations and Technology Nicole Murphy has spent more than three decades building a career defined by service. As chair of the Manufacturing Institute’s 2026 STEP Ahead Awards, she brought that same philosophy to one of manufacturing’s biggest celebrations of leadership.
A high-impact role: Murphy started her career as an engineer on the shop floor of a chemical plant. She was quickly drawn to the complexity of process and product development, a passion that led her to biotechnology and, ultimately, to a career focused on improving lives.
- At Biogen, Murphy leads a team responsible for developing, making and delivering medicines at the highest level of quality that support the company’s portfolio in neurology, immunology and rare disease. Her team’s work spans from early preclinical development to clinical and commercial stages, helping ensure promising science reaches patients safely and reliably.
- “I tell people often that I have the best job in the world—and I truly believe it,” said Murphy.
A defining moment: For Murphy, the work is deeply personal. During a factory tour early in her career, she met a family whose 6-year-old daughter relied on the medicine produced by the facility. The girl’s older brother quietly told her, “Thank you for getting my sister out of her wheelchair and letting her play with me again.”
- “That day reinvigorated a sense of purpose that has stayed with me, day in and day out,” said Murphy. “It has pushed me to continue to ‘raise the bar’ because the hard work we do is nothing compared to what our patients persevere through.”
Mentorship is key: Murphy attributes her success to the many role models who have supported her career, including mentors and peers. They challenged her to leave her comfort zone by taking on new responsibilities, roles and projects—and helped her grow as a leader.
- She has since paid that forward. At Biogen, Murphy started a Reverse Mentorship program that flips the traditional mentor/mentee relationship, empowering employees at all levels to mentor senior leaders.
- “The intent is to strengthen working relationships, improve our understanding of employee experience—particularly through a lens of inclusion—and help leaders gain new perspectives,” said Murphy. The result is more effective leadership, stronger teams and a thriving culture, she says.
Her leadership philosophy: Murphy believes the strongest leaders listen first, take responsibility for setbacks and make sure their teams receive the credit for success.
- “Trust, purpose and community are absolutely foundational in building the best teams,” said Murphy.
The last word: “Manufacturing succeeds when we develop and elevate diverse talent, and STEP Ahead shines a light on leaders who are shaping the future of the industry,” said Murphy.
- “It is our workforce that will create the great next invention, ensure products and services reach the people who need them and inspire the generations to come.”
Amazon Launches New Supply Chain Business

Amazon has launched a new global business based on the internal logistics network it’s spent two decades building (The Wall Street Journal, subscription).
What’s going on: The company “is trying to do for logistics what its Amazon Web Services unit did for cloud computing with a new business called Amazon Supply Chain Services.”
- The new service, announced on Monday, is “a centralized place for companies from consumer-goods manufacturers to apparel retailers to hire Amazon for services such as fulfillment, ocean and air shipping, and truck transportation.”
Why it’s important: The move makes Amazon a third-party logistics provider and “positions [it] to take a bigger bite out of a global market for third-party logistics services that is estimated at more than $1.3 trillion.”
- In 2025, Amazon became the world’s largest 3PL firm based on gross logistics revenue.
What’s different about it: While Amazon businesses thus far “have largely been offered piecemeal,” the new offering will aim to fulfill customers’ “full supply chain needs.”
A marketplace opening: The new business comes at the right time for many companies, which have increasingly been outsourcing their logistics services in recent years as a way to save money and better manage disruptions.
What to Expect: Trump–Xi Meeting
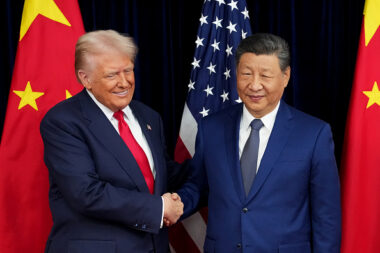
Presidents Trump and Xi will cover a wide array of topics at their meeting in China this week: Iran, Taiwan, nuclear weapons, artificial intelligence and rare earths, according to U.S. officials (Reuters, subscription).
What’s going on: Against the backdrop of a possible extension of a U.S.–China critical minerals deal, on Thursday and Friday “[t]he leaders of the world’s two largest economies will hold their first face-to-face talks in more than six months as they try to stabilize ties strained by trade, the U.S. and Israeli war with Iran and other areas of disagreement.”
- In what will be President Trump’s first China trip since 2017, the two nations “are expected to agree to forums to facilitate mutual trade and investment, while China is expected to announce purchases related to Boeing airplanes, American agriculture and energy.”
There’s more: Also potentially on the docket for the two-day meeting is a formal announcement of a Board of Trade and a Board of Investment.
- The former, a concept that came out of March U.S.–China talks, is a framework to expand trade and economic cooperation between the countries, while the latter is said to be for the management of investment disputes (The Wire China).
- However, the boards “may need subsequent work before they can be implemented, one of the officials said,” according to Reuters.
Rare earths: At the meeting, Presidents Trump and Xi could lengthen a trade-standoff truce that allows some rare earth minerals to be exported from China into the U.S.
- After imposing export controls on several rare earth elements in 2025, China suspended the restrictions for some rare earths but left others in effect.
“Thornier issues”: The presidents are also set to discuss Iran, Taiwan, AI and nuclear arms.
- China maintains ties with Iran, and President Trump has reportedly been urging China to press the regime in Tehran to accept a U.S. peace deal.
- “Xi, meanwhile, is frustrated with Washington over Taiwan. The U.S. remains the most important international backer and arms supplier for the democratically governed island, which Beijing claims as its own Chinese territory.”
- In addition, the Trump White House has “expressed increasing concern about advanced artificial intelligence models being developed in China.”
- Last, President Trump has long wanted to discuss nuclear weapons with President Xi, but Beijing “remains reluctant to discuss its arsenal.”
Rep. Miller Talks Tax Certainty with the NAM

As part of the NAM’s campaign to highlight the sweeping benefits of the 2025 tax law, which made permanent many crucial pro-manufacturing provisions, the NAM spoke to Rep. Carol Miller (R-WV) about her work in achieving tax certainty for manufacturers and all Americans.
Why it matters: “The Working Families Tax Cuts will deliver meaningful relief to American manufacturers, driving the development of new facilities, the creation of jobs and increased investment across the country,” said Rep. Miller.
- “The Ways and Means Supply Chain Tax Team focused on advancing pro-growth policies to fuel long-term economic prosperity,” she continued, discussing the legislative process that secured this victory for manufacturers.
- “Key provisions in the legislation—including permanent research and development expensing, full immediate expensing, a strengthened interest deduction and a 100% factory construction deduction—provide businesses with the certainty and incentives needed to plan, invest and compete globally,” she said.
The corporate rate: Rep. Miller singled out the lower corporate rate as essential to manufacturing competitiveness in the U.S., saying, “The preservation of the 21% corporate rate is critical in promoting American manufacturing because companies can invest in expanding infrastructure, purchase new equipment and increase workforce without tax liability uncertainty.”
- In addition, “The Working Families Tax Cuts compounded with bonus depreciation and immediate research expensing have proved to be effective for the industry, and we will continue to advocate for pro-growth policy that leads to new markets and more opportunities.”
Seeing the benefits: When asked about the impact of the Working Families Tax Cuts on her constituents, Rep. Miller said, “In my home district, we’ve seen these policies translate into new factories, new jobs and expanded opportunities.”
- “Companies like Conn-Weld Industries and Ferroglobe have used this tax relief to invest in their operations, grow their businesses and strengthen the local economy.”
What manufacturers should do: “NAM members should share their stories and voice their support for the Working Families Tax Cuts and communicate the real-world impact this legislation has on the country, their business and the employees and their families who benefit,” Rep. Miller urged.
- “Manufacturers are at the core of our economy and need a predictable and pro-growth tax code.”
Read the whole thing: You can find the full Q&A here.