News & Insights

GOP Seeks to Undo California’s Strict Emissions Rules
Rep. John Joyce (R-PA) is continuing his push against California air pollution rules (
Bristol Myers Squibb Hopes to Boost Drug Trials with NVIDIA Supercomputer
Biopharmaceutical manufacturer Bristol Myers Squibb will soon become the first life sciences firm to buy semiconductor maker NVIDIA’s latest generation supercomputer (
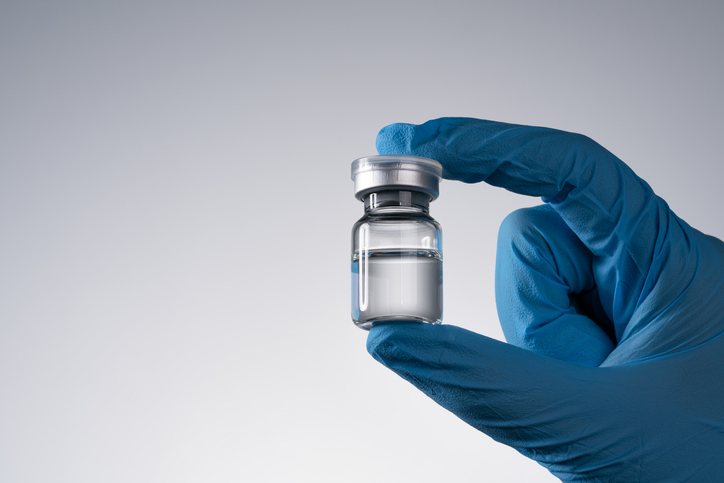
Why the SAFE Drugs Act Matters for Americans’ Health
Even though compounded versions of semaglutide and tirzepatide are no longer permissible under law, now that a temporary shortage of the real medicines has ended, these dangerous and unregulated drugs remain widely available, according to a new said lead researcher Michael DiStefano, of the University of Colorado Anschutz Skaggs School of Pharmacy and Pharmaceutical Sciences. …
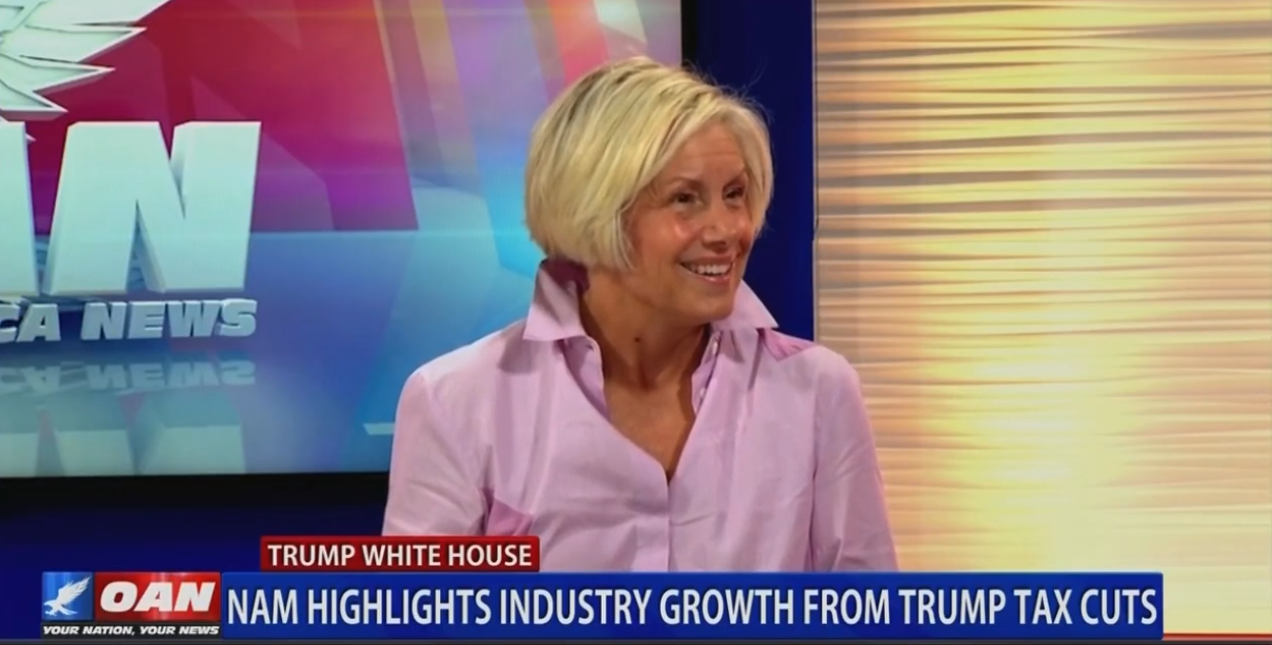
Streeter Touts H.R. 1 Manufacturing Wins on Air
NAM Executive Vice President Erin Streeter took to the airwaves to spotlight “highlighted the report last week. The segment then cut to a clip from the White House press briefing, where Leavitt cited stories from the NAM’s flipbook, before returning to Streeter’s interview. “A ripple effect”: Streeter also talked about Ketchie Inc., whose president and …
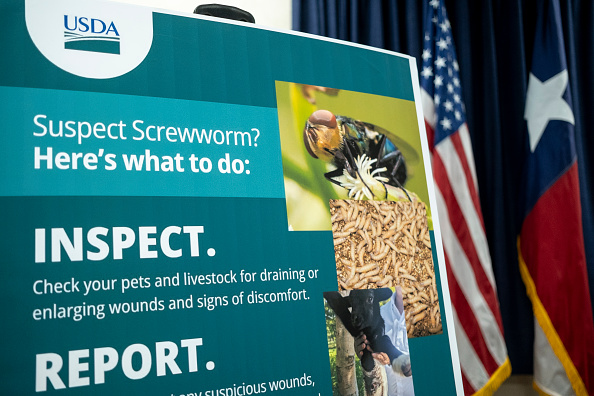
USDA Rushes to Eradicate the Screwworm Fly Again
U.S.-funded researchers in Panama are preparing for the first outdoor test of genetically modified screwworm flies, aiming to neutralize the parasite that has spread from Central America into the United States (

Oil Producers Seek Alternative Routes to Strait of Hormuz
With Iran’s Strait of Hormuz blockade nearing the five-month mark, Gulf nations are preparing to spend big to redirect oil shipments (
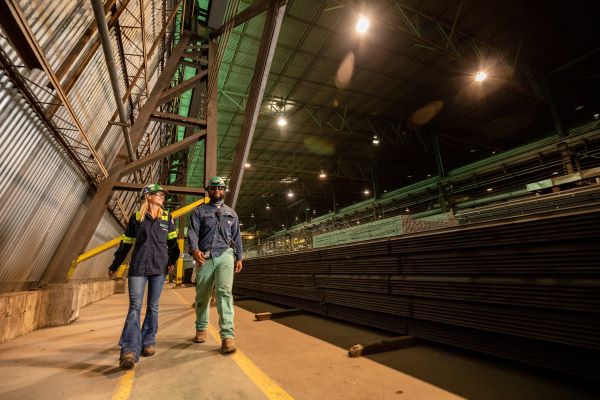
Nucor CEO: Mental Health Belongs at the Center of Safety Culture
For Nucor, North America’s largest steel manufacturer, mental health awareness isn’t something that takes place occasionally. It’s an essential part of the company’s safety program. What’s going on: “At Nucor, safety is our number one value. Mental health isn’t a separate program off to the side; it’s a core part of our safety program,” company …

Trump Imposes Sweeping Tariffs Under Section 301
As the 10% Section 122 tariffs expired at midnight on July 24, the U.S. Trade Representative on Thursday prepublished a