News & Insights

Lego Goes Digital
Lego is aiming to give screen time a run for its money (

GDP Grew 1.5% During Q2 in Advance Estimate
Gross domestic product rose at an annual rate of 1.5% in the second quarter according to the advance estimate, in comparison to an increase of 2.1% in the first quarter (
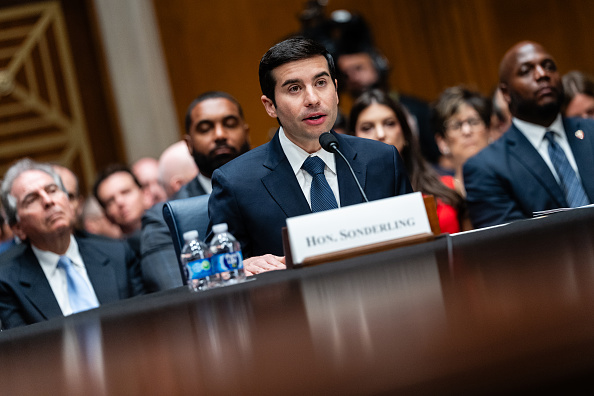
HELP Committee Advanced NAM-Supported Sonderling Nomination
The Senate Health, Education, Labor and Pensions Committee on Thursday advanced the nomination of NAM-backed acting Labor Secretary Keith Sonderling (stepped down in April.” The NAM’s support: The NAM and its 501(c)3 workforce development and education affiliate, the Manufacturing Institute, welcomed the nomination: What’s next: The nomination now goes to the full Senate for a …
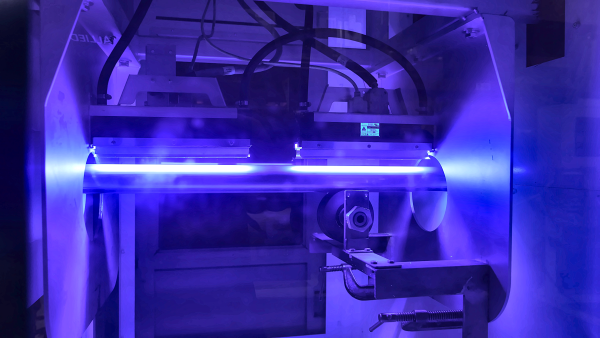
How the 2025 Tax Law Boosted Allied Photochemical
Allied Photochemical is feeling the positive effects of last year’s landmark tax law. Bonus depreciation and R&D expensing: H.R. 1’s permanent reinstatement of the 100% bonus depreciation rate and immediate expensing for domestic research and development has had a major impact on the UV-coatings manufacturer. The estate tax: H.R. 1 also increased and made permanent …
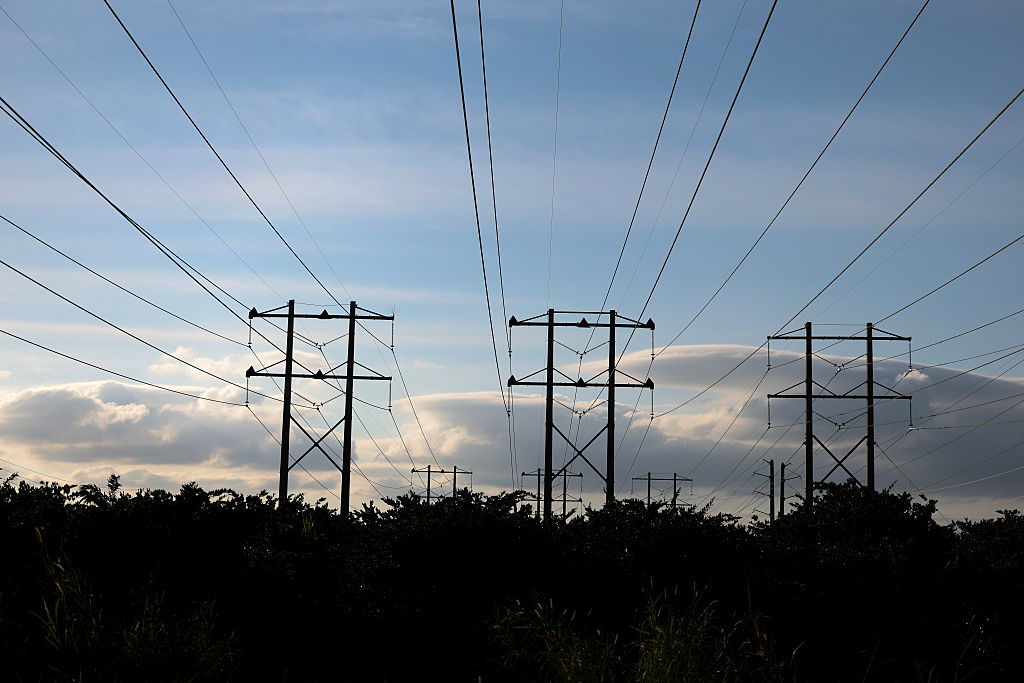
DOE Issues Emergency Grid Order for 17 States as Heat Persists
The U.S. Department of Energy has issued an emergency order to keep the power on in 17 states as temperatures stay elevated (

Ford to Make New Tactical Trucks for the U.S. Army
Ford has joined the race to make the U.S. Army’s newest tactical truck, it announced this week (have been lobbying automakers and their suppliers to help scale up defense production and leverage the industry’s manufacturing capacity to meet crucial military shortages brought on by wars in the Middle East and Russia’s invasion of Ukraine.” Not …
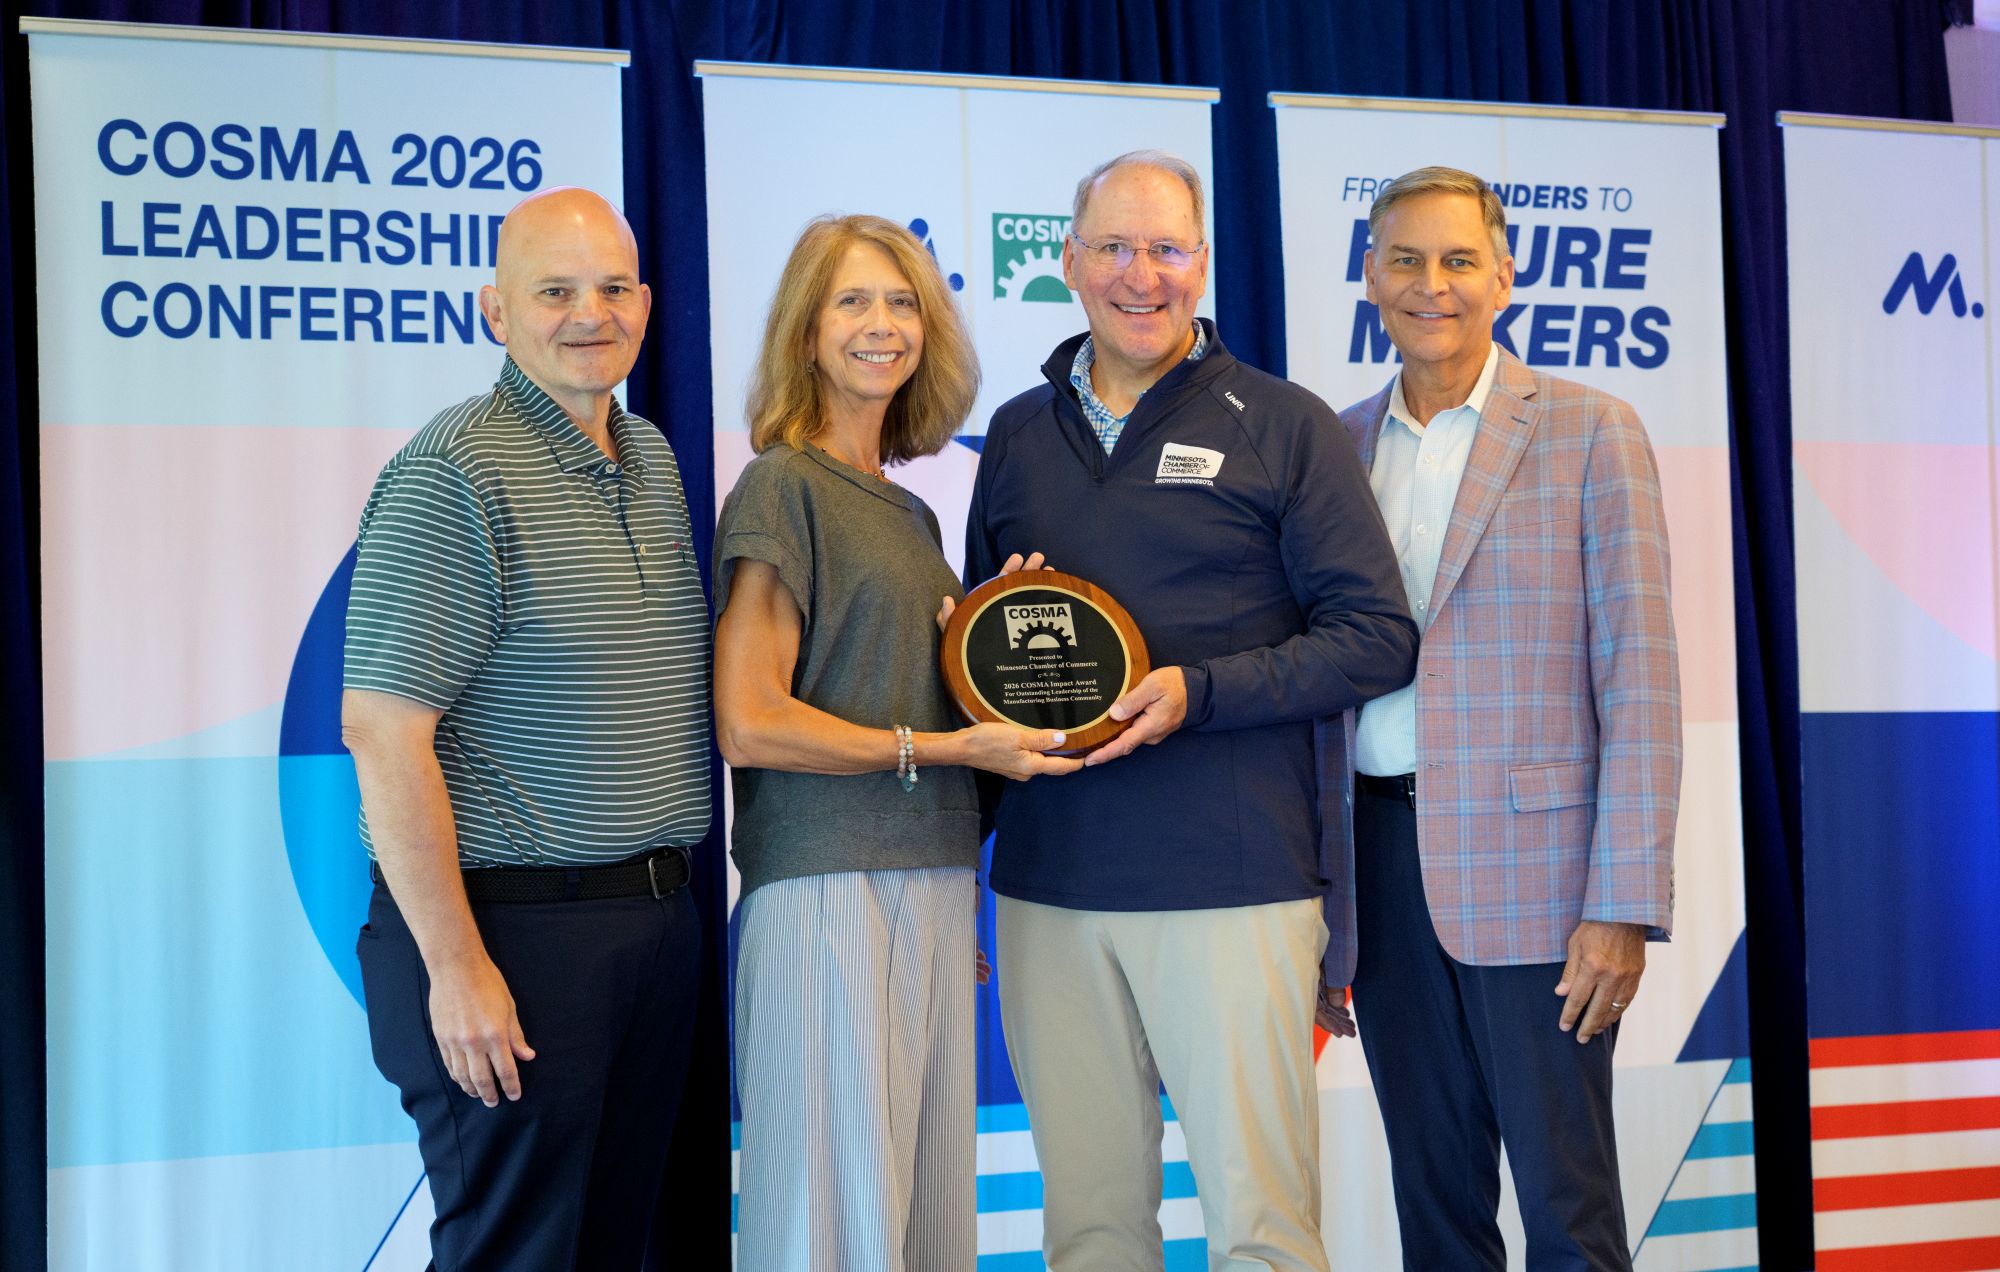
Minnesota Chamber of Commerce Wins Inaugural Impact Award
The Minnesota Chamber of Commerce received the first-ever 2026 Conference of State Manufacturers Associations’ Impact Award at the conference’s annual meeting this week, the NAM announced yesterday that the Arizona Chamber of Commerce & Industry received the 2026 COSMA Leadership Award.
D.C. Circuit Sides with NAM, EPA on Project Emissions Accounting Rule
An EPA rule allowing air permit applicants to count emissions increases and decreases as the first stage of New Source Review is lawful, a federal appeals panel ruled this week in a case involving the NAM as intervenor-respondent (social post.
COSMA Impact Award Honors Minnesota Chamber of Commerce
Colorado Springs, Colorado –The National Association of Manufacturers announced that the Minnesota Chamber of Commerce was recognized by the Conference of State Manufacturers Associations with the first-ever COSMA Impact Award at the conference’s annual meeting this week. COSMA’s members serve as official state partners of the National Association of Manufacturers, focusing on manufacturing priorities at …
EPA Pushes Back Worker Protection Deadline for Two Chemicals
The EPA has released a final rule delaying the deadline for certain worker protections mandated by the Biden administration for facilities using perchloroethylene (PCE) and carbon tetrachloride (CTC) (