News & Insights
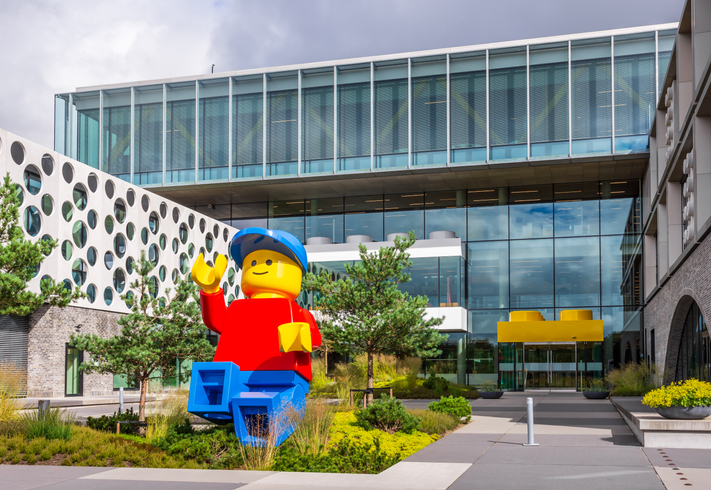
Lego Goes Digital
Lego is aiming to give screen time a run for its money (
GDP Grew 1.5% During Q2 in Advance Estimate
Gross domestic product rose at an annual rate of 1.5% in the second quarter according to the advance estimate, in comparison to an increase of 2.1% in the first quarter (
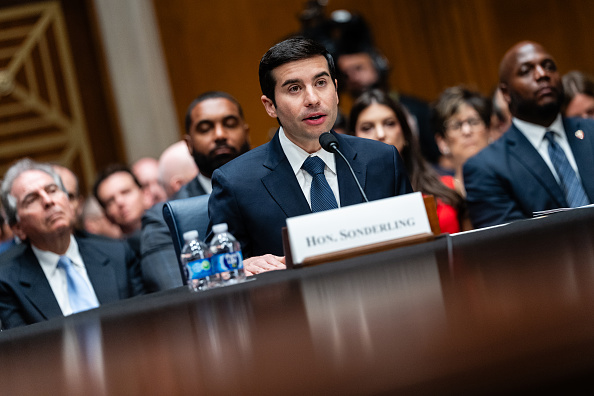
HELP Committee Advanced NAM-Supported Sonderling Nomination
The Senate Health, Education, Labor and Pensions Committee on Thursday advanced the nomination of NAM-backed acting Labor Secretary Keith Sonderling (stepped down in April.” The NAM’s support: The NAM and its 501(c)3 workforce development and education affiliate, the Manufacturing Institute, welcomed the nomination: What’s next: The nomination now goes to the full Senate for a …
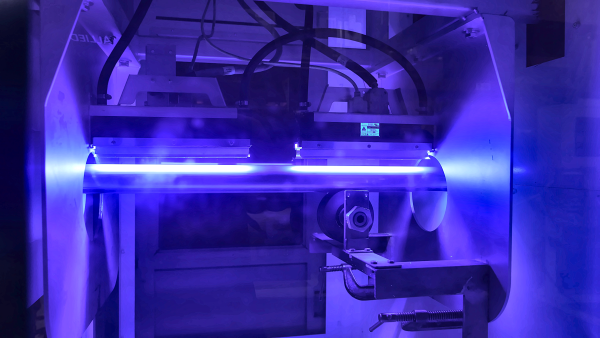
How the 2025 Tax Law Boosted Allied Photochemical
Allied Photochemical is feeling the positive effects of last year’s landmark tax law. Bonus depreciation and R&D expensing: H.R. 1’s permanent reinstatement of the 100% bonus depreciation rate and immediate expensing for domestic research and development has had a major impact on the UV-coatings manufacturer. The estate tax: H.R. 1 also increased and made permanent …