Lubrizol Chills Out with Liquid-Based Data Center Cooling
Everyone’s talking about where artificial intelligence is taking us, but few are discussing the immense amount of energy that will be needed to get there. That’s where Lubrizol comes in.
Cool operator: The global specialty chemicals company, with headquarters in Ohio, has a unique method of cooling IT in data centers, those behemoth facilities that power generative AI. As anyone who’s used a computer for long periods of time knows, that equipment can get hot.
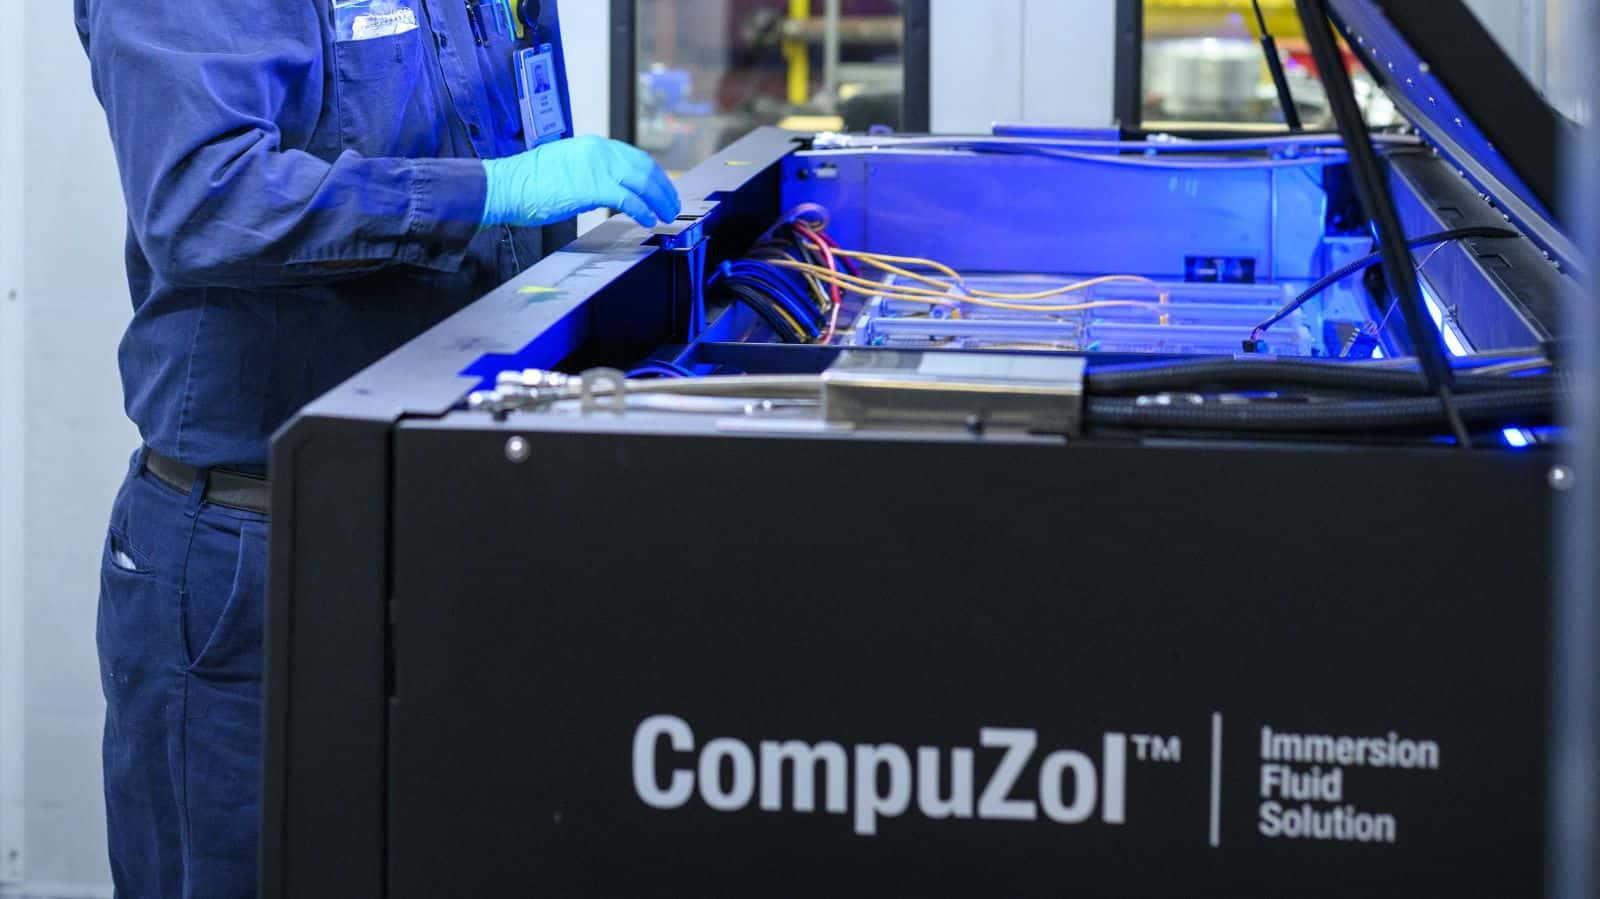
- To cool high-performance data centers’ graphics processing units—powerful accelerators that enable AI and other technologies and can generate huge amounts of heat—Lubrizol employs immersion cooling, a method of heat removal that uses liquid.
- “It’s like a blacksmith—when you try to remove heat from hot metal, you immerse it in cold water and the water removes the heat,” Lubrizol Vice President of Corporate Innovation Abhishek Shrivastava told us.
- But at Lubrizol, “we are immersing the computer chips in a formulated oil” instead of water. “These GPUs are working so hard with higher power consumption, they can actually melt if they get too hot. So, you need to remove the heat quickly and efficiently.”
Why we need it: Most current data centers use air cooling, but their increasing workloads and processing capacity—driven by the fast-growing appetite for AI—will require something more efficient, Shrivastava said.
- Meanwhile, next-generation processing units will maintain a thermal design power (i.e., heat) of more than three times today’s commonly used systems, according to Lubrizol.
- “AI is needed for the future—for economic development, for global leadership,” Shrivastava said. “It will come down to who can deploy it faster.”
The tech: Lubrizol believes its method of immersion cooling—which relies on nonconducting, dielectric fluids, or liquids that act as electrical insulators—is the key to winning that race.
- “As AI infrastructure is deployed [in the U.S.], there must be efficient cooling in place too,” Shrivastava continued. “It’s going to require a lot of infrastructure-level investment.”
- Up to 40% of data centers’ total annual energy consumption goes to their cooling systems, according to a recent study by the Electric Power Research Institute. Lubrizol’s technology greatly reduces that percentage for its customers.
Getting started: Lubrizol’s immersion cooling technology has been deployed at multiple data centers, and the company is working with its customers to scale up installations. “A lot of small players are using it, because if you’re small, your risk is low and deployment is fast, but there are some large-scale deployments across the world including in China and the U.S. that show the big players have identified the value,” Shrivastava said.
- Among the company’s next steps: getting the solution deployed at larger centers—though that will take some time. “Larger-scale operations need more data, more confidence in [new] technology,” Shrivastava noted.
Years, not decades: In the long term, however, the cost-benefit analysis is very favorable, said Shrivastava, even with infrastructure development outlay. And Shrivastava foresees widespread use of the technology.
- Awareness of the need for high-powered, efficient cooling is growing. “We’re not talking about a matter of decades” before it’s in wide use; “it’s a matter of years and months.”
The last word: “The industry needs to pick up the pace” on the data center cooling front, Shrivastava told the NAM. “Otherwise, we’re not going to realize the full potential of AI.”
Tariff Pressures Mount: Prices and Supplier Delays Hit New Highs
The S&P Global U.S. Manufacturing PMI was 52.0 in May, the fifth consecutive month of growth and up from 50.2 in April. PMI growth was led by a rise in new orders and a dramatic increase in input inventories, which rose at a pace not seen in the indicator’s 18-year history even amid higher prices. Domestic demand was the primary driver to new order growth, along with efforts to frontload production ahead of greater tariff impacts. Additionally, optimism increased slightly after falling sharply in April, and employment advanced for the first time in three months. On the other hand, production declined for the third month in a row and at a slightly faster pace than in April.
Tariffs led to steep increases in both input and output costs, which rose at the highest rate since November 2022. Raw material prices remained elevated, despite dropping to a three-month low, amid reports of manufacturers passing on higher tariff-related costs. Additionally, tariffs continue to cause supply-side disruptions, as supplier delays have risen to the highest degree since October 2022 and are leading to growing vendor shortages. Small manufacturers and those in consumer-facing markets seem to be hit most severely by the impact of tariffs on prices and supply.
Nevertheless, manufacturers felt more optimistic that economic conditions will be more stable in a year’s time, particularly expecting tariff disruptions to dissipate in the months ahead. Therefore, confidence reached a three-month high to right above the survey average.
Unfilled Orders Hold Steady; Inventory Levels Flatten
New orders for manufactured goods fell 3.7% in April following four consecutive monthly increases. When excluding transportation, new orders slipped 0.5%. Orders for durable goods dropped 6.3%, following a 7.6% increase in March. Year to date, durable goods orders are up 4.2%. Nondurable goods orders ticked down 0.9% in April after declining 0.7% in March. Nondurable goods orders are down 0.1% over the year.
New orders for nondefense aircraft and parts led the decrease in durable goods, falling 51.5%, after leaping 158.5% in March. In April, the largest monthly increase occurred in ships and boats, which rose 92.1%, after slipping 4.7% the month prior. The largest over-the-year changes also occurred in nondefense aircraft and parts (up 85.5%) and mining, oil field and gas field machinery (down 9.7%).
Factory shipments decreased 0.3% in April, after slipping 0.2% in March. Shipments over the year increased 0.9%. Shipments excluding transportation fell 0.6% in April, following a 0.3% decrease the previous month. Shipments for durable goods improved 0.3% in April, up from a 0.2% increase in March and up 1.8% year to date. Meanwhile, nondurable goods shipments declined 0.9% in April and are down 0.1% year to date.
Unfilled orders for all manufacturing industries stayed the same in April, following a 1.6% increase in March. Inventories edged down 0.1%, after rising 0.1% for the past four months, and the inventories-to-shipments ratio rose to 1.58 from 1.57. The unfilled orders-to-shipments ratio for durable goods decreased to 6.77 from 6.86 in March.
Supply Chains Tighten Even as Demand Softens
In May, global manufacturing activity contracted for the second consecutive month and at a slightly faster pace, falling from 49.8 to 49.6. For the first time in five months, output fell back into negative territory as a result of declining new orders and export business. Supply chains are stretched despite reduced purchase volumes, with vendor lead times lengthening and delivery times increasing to the greatest extent in six months. Nevertheless, the outlook strengthened, with business optimism rising from April’s two-and-a-half-year low.
India, Greece and Colombia had the highest PMI readings in May, while the Eurozone’s pace of contraction continued to improve for the third consecutive month. On the other hand, China, Japan and the U.K. were some of the larger nations to register declines in activity, and those contractions more than offset activity growth in the U.S. The overall downturn in manufacturing output reflected weakness in the intermediate and investment goods sectors. On the other hand, consumer goods production rose for the 22nd month in a row.
Additionally, manufacturing employment fell for the 10th consecutive month in May but at a slower pace than the prior month. Although staffing levels rose in the U.S., Japan and India, they sank notably in China, the Eurozone and the U.K. While remaining high, both input costs and selling price increases eased to the slowest pace in several months.
Labor Market Still Tight Despite Slower Hiring in Industry
Job openings for manufacturing decreased by 16,000, from 397,000 in March to 381,000 in Furthermore, the March job openings level of 397,000 was revised downward dramatically from 449,000 in the previous report. Nondurable goods job openings in April stayed the same at 136,000, while durable goods job openings declined by 16,000, from 261,000 in March to 245,000 in April. The manufacturing job openings rate edged down to 2.9% from 3.0% in March and fell from 3.7% the previous year. The rate for nondurable goods manufacturing stayed the same at 2.7%, while it slipped 0.2% to 3.0% for durable goods.
In the larger economy, the number of job openings rose to 7.4 million, an increase of 191,000 from the previous month but a decrease of 228,000 from the previous year. The job openings rate ticked up to 4.4%, up from 4.3% in March but down from 4.6% last year. This data reflects an overall labor market that has eased back to pre-pandemic levels, but remains strong and tight from a historical perspective.
The number of hires in the overall economy increased 169,000 to 5.6 million in April but dropped 11,000 from the previous year. The hires rate for the overall economy inched up 0.1% in April to 3.5%. Meanwhile, the hires rate for manufacturing similarly ticked up 0.1% in April to 2.6%. The hires rate for durable goods rose 0.2% to 2.6% but edged down 0.1% to 2.6% for nondurable goods.
In the larger economy, total separations, which include quits, layoffs, discharges and other separations, rose 105,000 from March to 5.3 million and dropped 100,000 from the previous year. The total separations rate stayed the same at 3.3% for the overall economy but inched up 0.1% for manufacturing to 2.5%. Within that rate, layoffs and discharges increased by 14,000 in April for manufacturing, while quits increased by 2,000. The quit and layoff rates continue to remain lower for manufacturing than the total nonfarm sector.
Job Gains Continue, Though Labor Force Shrinks Slightly
Nonfarm payroll employment increased by 139,000 in May, slightly beating expectations. On the other hand, April’s job gain was revised downward dramatically by 30,000, from 177,000 to 147,000. The 12-month average stands at 149,000 job gains per month. The unemployment rate stayed the same at 4.2%, while the labor force participation rate edged down 0.2% to 62.4%.
Manufacturing employment slipped by 8,000, but the April loss of 1,000 was revised upward by 6,000 jobs to an increase of 5,000. Durable goods manufacturing employment fell by 7,000, while nondurable goods employment declined by 1,000. The most significant gain in manufacturing in May occurred in food manufacturing, which added 3,900 jobs over the month. Meanwhile, the most significant losses occurred in machinery manufacturing, which shed 7,300 jobs over the month, followed by paper manufacturing, which lost 1,500 jobs.
The employment-population ratio slipped 0.3% to 59.7% and is down 0.4 percentage points from a year ago. Employed persons who are part-time workers for economic reasons decreased by 66,000 to 4.60 million but are up from 4.42 million in May 2024. Native-born employment is down 444,000 over the month but up 1,337,000 over the year. Meanwhile, foreign-born employment is down 224,000 over the month but up 683,000 over the year.
Average hourly earnings for all private nonfarm payroll employees rose 0.4%, or 15 cents, reaching $36.24. Over the past year, earnings have grown 3.9%. The average workweek for all employees stayed the same at 34.3 hours but ticked up 0.1 hour for manufacturing employees to 40.1 hours.
U.S. Manufacturing Contracts for Third Straight Month
In May, the U.S. manufacturing sector contracted for the third consecutive month and at a slightly faster pace than the prior month, with the ISM Manufacturing® PMI decreasing to 48.5% from 48.7% in April. Customer demand and output slowed, while inputs started to weaken. The New Orders and Production Indexes continued to contract but at a slower pace, rising to 47.6% and 45.4%, respectively. Meanwhile, the New Export Orders and Imports Indexes contracted at a faster pace, plummeting to 40.1% and 39.9%, respectively. As anticipated, inventories (46.7%) contracted after growing in April, as companies completed pull-forward deliveries ahead of increased tariffs.
The New Orders Index contracted for the fourth consecutive month but at a slightly slower pace than the prior month, a 0.4 percentage point rise from April. The index hasn’t shown consistent growth since a 24-month streak of expansion ended in May 2022. Of the six largest manufacturing sectors, two—petroleum and coal products; and machinery—reported an increase in new orders. Respondents noted weakening demand, with a lack of new orders from overseas customers being a key factor.
The New Export Orders Index contracted for a third consecutive month and at the fastest pace since the pandemic to 40.1%, 3.0 percentage points lower than April. The sharp contraction was due to the combination of slower global growth as well as the application of retaliatory tariffs applied to a variety of U.S.-manufactured products. Meanwhile, the Imports Index contracted for a second consecutive month, plunging 7.2 percentage points to 39.9% in May. Imports continue to contract as tariff pricing results in lower demand compared to prior months.
The Employment Index contracted for the fourth consecutive month but at a slower pace than the prior month, a 0.3 percentage point bump from April. Of the six-largest manufacturing sectors, only one—petroleum and coal products—reported increased employment. Companies continued to reduce headcounts through layoffs, attrition and hiring freezes, while opting for layoffs at an accelerating pace due to uncertainty around future demand.
The Prices Index fell 0.4 percentage points to 69.4%, indicating raw materials prices increased for the eighth straight month in May, driven by the dramatic rise in steel and aluminum prices impacting the entire supply chain, as well as the broad 10% tariff applied to imported goods. Forty-five percent of companies reported paying higher prices, down slightly from 49% in April but still up dramatically from 21% in January.
Manufacturing Employment Inches Downward

Manufacturing employment dipped slightly in May, losing 8,000 jobs on a seasonally adjusted basis, according to the monthly employment report from the Bureau of Labor Statistics. Nonfarm payrolls overall added 139,000 jobs last month.
The details: “The unemployment rate held at 4.2% in May and has remained in a narrow range of 4.0% to 4.2% since May 2024.”
- Meanwhile, nonfarm payrolls have averaged a monthly gain of 149,000 over the past 12 months, in line with the reading from May.
In manufacturing: “In manufacturing, the average workweek was little changed at 40.1
hours, and overtime was unchanged at 2.9 hours.”
- Meanwhile, average hourly earnings in manufacturing crept up from $35.11 in April to $35.28 in May on a seasonally adjusted basis.
The long view: Manufacturing employment has declined over the past year to date, yet remains above pre-pandemic levels, with 12,761,000 workers in May. The sector averaged 12,648,000 employees pre-pandemic (2017–2019).
The NAM says: “In order to support manufacturing growth and job creation in the U.S., manufacturers are calling on Congress to pass the One Big Beautiful Bill Act swiftly and make pro-manufacturing tax policies permanent,” said NAM Managing Vice President of Policy Charles Crain.
Power Markets Warn FERC of Increasing Risk of Outages

The artificial intelligence–driven rise in energy demand from the tech sector is adding more strain to the U.S. power grid, boosting the risk of outages to “new highs,” regional power market executives said at a regulatory conference this week (POLITICO Pro’s ENERGYWIRE, subscription).
What’s going on: “Grid rules developed during periods of relatively slow growth aren’t equipped for the demands of Silicon Valley’s investment in artificial intelligence, extreme weather shocks and deep national and state political divisions over energy and climate policy, grid operators told members of the Federal Energy Regulatory Commission.”
- PJM Interconnection, which has 67 million customers in the eastern U.S., forecasts a 32-gigawatt power demand increase through 2030, “of which 30 is from data centers,” CEO Manu Asthana told FERC.
- Southwest Power Pool, with approximately 19 million customers in the Great Plains states, said it projects peak demand “to be as much as 75% higher 10 years from now,” largely due to data centers and electrification.
Why the outage threat is worsening: Extreme weather events and greater use of weather-dependent energy sources such as wind and solar make “outages … 125 times more likely to happen [now] than eight years ago.”
What’s needed: C-suite leadership told regulators there are steps that can—and must—be taken to mitigate the worsening risk. These include:
- Stabilized market rules and “find[ing] that intersection between reliability and affordability that works both for consumers and suppliers, and that intersection is getting harder and harder to find”;
- “[M]uch deeper insight” into future electricity supply and demand and probabilities of extreme weather;
- More and better real-time information about the effect of dangerous storms on gas pipeline deliveries to electric turbines;
- “[S]tronger modeling of fuel and capacity performance to assess reliability risk”; and
- The establishment of an agreed-upon profile of the risks operators likely face.
Adding to the problem: Making matters worse are the vastly different climate policies between states, which put regional power markets “in an impossible position,” FERC Chair Mark Christie said at the conference.
- One possible solution: give states more responsibility for fixing grid reliability problems on their own.
The NAM says: As the NAM recently told the House’s AI and Energy Working Group, led by Rep. Julie Fedorchak (R-ND), “A reliable, resilient modern grid is required to enable the historic growth in data centers, which in turn can contribute to manufacturing growth.”
To Drive Domestic Growth, Manufacturers Propose U.S. Manufacturing Investment Accelerator Program to Boost Access to Manufacturing Inputs
Washington, D.C. – The National Association of Manufacturers today unveiled the U.S. Manufacturing Investment Accelerator Program, a programmatic proposal designed to help manufacturers deliver on President Trump’s vision of America as a global manufacturing powerhouse.
“President Trump’s administration is prioritizing policies that spur more investment and innovation in manufacturing in the U.S.—a goal that manufacturers share. As the administration pursues reciprocal trade deals, the NAM is seeking zero-for-zero tariff outcomes with our top export markets,” said NAM President and CEO Jay Timmons. “As these deals materialize, manufacturers need a runway of predictable access to the critical inputs necessary to make things in America, empowering them to invest, create jobs, grow and compete. The U.S. Manufacturing Investment Accelerator Program is a manufacturing ‘speed pass’ that will unlock long-term investments needed to maintain America’s edge in the global economy.”
Why the program is needed right now: Even if the manufacturing industry were operating at full capacity—every machine turned on, every job filled—then the industry could produce only 84% of the inputs necessary to meet demand. That means that at least 16% of manufacturing inputs must be imported to grow domestic manufacturing.
Tariffs on critical manufacturing inputs dramatically increase the cost of these must-use, must-import inputs, thus hindering the very investment needed to grow manufacturing jobs in the U.S. These inputs are raw materials, critical minerals and energy resources—as well as some equipment and machinery our industry needs to install on the shop floor to enable U.S. production.
Timmons added, “The U.S. Manufacturing Investment Accelerator Program offers a way to bring in essential inputs that aren’t produced in the U.S. without added cost burdens—and it rewards manufacturers that expand production, invest in new equipment and create jobs here at home. Every dollar of imported manufacturing inputs has a multiplier effect, generating $1.40 on average in manufacturing output in the U.S. This proposal is a practical, pro-growth approach that supports President Trump’s trade priorities and turns his goal to strengthen manufacturing in America for the long term into reality.”
Background on the U.S. Manufacturing Investment Accelerator Program:
- A Manufacturing Speed Pass
- To reduce the cost burdens that hinder domestic manufacturing investment, the administration should utilize existing authorities to issue general licenses—effectively a manufacturing speed pass—that allow manufacturers to import essential inputs duty-free.
- This includes raw materials, machinery, components and R&D inputs not readily available domestically.
- Eligible manufacturers would self-certify under defined criteria and be subject to post-entry verification by U.S. Customs and Border Protection.
- The Treasury Department, which has experience with general licensing frameworks, would be tasked with implementation.
- Manufacturing Investment Accelerator Rebates
The administration should provide a rebate to offset tariff costs incurred on must-import inputs when manufacturers are investing or expanding manufacturing in the U.S. Rebates would apply to:
- New or expanded manufacturing facilities;
- Technological upgrades and equipment modernization;
- Hiring of full-time manufacturing employees; and
- Domestic R&D expenditures.
Additionally, to ensure the program remains responsive and effective in generating manufacturing expansion in the U.S., the NAM recommends convening a Quarterly Manufacturing Dialogue between manufacturers and key federal agencies, including U.S. Treasury, the Office of the U.S. Trade Representative, the Department of Commerce and the Small Business Administration, among others.This ongoing forum would allow for real-time feedback, operational updates and continuous improvement of the Accelerator Program to better serve manufacturers in America.
The NAM also today unveiled a first-of-its-kind new data analysis visualized in a trade map, offering a state-by-state look at the increase in tariff costs borne by manufacturers and the need for globally sourced critical inputs necessary to make things in America—such as raw materials, critical minerals and energy sources.
The NAM’s Q2 2025 Manufacturers’ Outlook Survey showed manufacturers’ optimism has dropped to 55.4%, the lowest level since the height of the COVID-19 pandemic in Q2 2020. Trade uncertainty remained the top business concern for the second consecutive quarter, cited by 77.0% of respondents.
-NAM-
The National Association of Manufacturers is the largest manufacturing association in the United States, representing small and large manufacturers in every industrial sector and in all 50 states. Manufacturing employs nearly 13 million men and women, contributes $2.93 trillion to the U.S. economy annually and accounts for 53% of private-sector rese arch and development. The NAM is the powerful voice of the manufacturing community and the leading advocate for a policy agenda that helps manufacturers compete in the global economy and create jobs across the United States. For more information about the NAM or to follow us on Twitter and Facebook, please visit www.nam.org.