
Centrus, Fluor Partner to Expand Ohio Uranium Enrichment Site
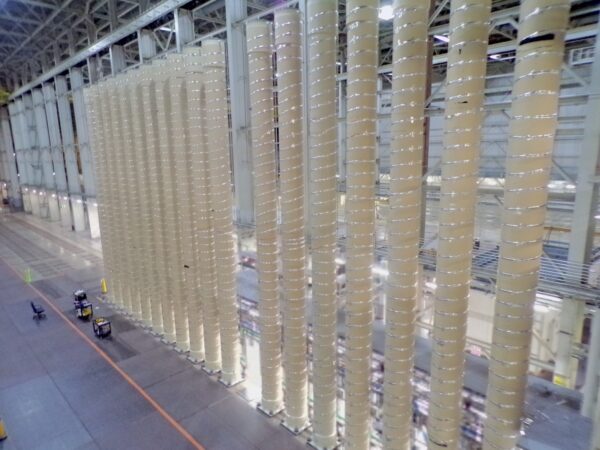
The subsidiary of U.S. uranium enrichment company Centrus has contracted with engineering firm Fluor for the multibillion-dollar expansion of its uranium enrichment facility in Piketon, Ohio (Centrus).
What’s going on: American Centrifuge Operating LLC—the wholly owned daughter company of Bethesda, Maryland–based Centrus—has engaged Fluor “to serve as its engineering, procurement and construction (EPC) contractor as Centrus proceeds with its previously announced” Ohio facility buildout.
What it will entail: “Under the multiyear contract, Fluor will lead engineering and design of the expanded capacity in Ohio, manage the supply chain and procurement of key materials and services, oversee construction at the site and support the commissioning of the new capacity.”
About the undertaking: The Piketon project includes substantial production of Low-Enriched Uranium (LEU) “to address [the] commercial LEU enrichment contingent backlog of $2.3 billion and growing demand from existing reactors.”
- Centrus will also build “12 metric tons of High-Assay, Low-Enriched Uranium (HALEU) annual capacity for next-generation reactors.”
Related news: In January, Centrus announced that it had been selected by the Department of Energy for a $900 million task order to expand its enrichment and centrifuge manufacturing capabilities at Piketon and its facility in Oak Ridge, Tennessee.
- The company said later last month that it would invest more than $560 million to turn its Oak Ridge centrifuge factory into a “high-rate manufacturing” site.
The NAM’s take: “Current and future energy demand requires a strong domestic nuclear fuel supply chain,” said NAM Senior Director of Energy and Resources Policy Mike Davin.
- “The expansion of Centrus’ Ohio enrichment facility—and the news of the company’s partnership with Fluor to make the project happen—is a win for manufacturing and the U.S. in general.”
NAM to FDA: Expand Nonprescription Drug Access to Cut Manufacturers’ Health Care Costs

Greater access to nonprescription drugs can reduce health care costs for manufacturers and improve quality of life for their employees, the NAM told the Food and Drug Administration this week.
What’s going on: The FDA put out a request for information on how to increase access to nonprescription drugs. The NAM shared manufacturers’ longstanding commitment to providing health benefits to their workers as both an effective tool to attract and retain employees and to maintain a healthy and productive workforce. It also explained how rising health care costs have been a great challenge for the industry.
- Expanding access to over-the-counter medications—which are typically affordably priced, widely available and can be purchased and taken as soon as they are needed—can save time and money for employers and employees alike.
The benefits: “Prescription drugs require doctor’s visits, which involve not just the time spent at the appointment itself, but also the time needed to schedule an appointment or locate an in-network provider if a patient does not already have one, as well as the financial cost of a copay or coinsurance,” the NAM said, explaining why people need access to OTC drugs, in addition to prescriptions.
- “Manufacturing workers taking time off from work to see a doctor reduces workplace productivity at a time when the industry is already facing a manufacturing worker shortage. OTC drugs can help workers to recover more quickly and return to work sooner.”
What else should be done: Manufacturers commend the administration for its efforts to expand access to OTC medications. The NAM recommended several steps the FDA can take to increase access, including:
- Rebalance regulations and reduce unnecessary burdens in the nonprescription drug regulatory process;
- Broaden the risk/benefit assessment for nonprescription drugs to include the consideration of benefits beyond those to the individual patient, such as to population health, the health care system overall and the economy;
- Broaden the FDA consideration of which drugs can be switched from prescription to nonprescription;
- Include specialized care professionals and patient advocates on advisory councils; and
- Maintain the three-year exclusivity incentive for some prescription to OTC drug switches that require significant financial investment.
The last word: “Increased access to nonprescription drugs is crucial for manufacturers as providers of employer-sponsored insurance, and for manufacturers of consumer health care products, who strive every day to improve the health and lives of Americans,” said NAM Vice President of Domestic Policy Jake Kuhns and NAM Director of Health Care Policy Jess Wysocky.
Home Price Indexes Point to Broad Cooling Across Regions
In November, the S&P Cotality Case-Shiller U.S. National Home Price NSA Index recorded a 1.4% annual gain, consistent with the gain in October. The 10-City Composite increased 2.0%, up from 1.9% the previous month, while the 20-City Composite rose 1.4% year-over-year, up from 1.3%. Among the 20 cities, Chicago posted the highest annual gain at 5.7%, followed by New York at 5.0% and Cleveland at 3.4%. Tampa again posted the lowest annual return, with prices falling 3.9%.
On a month-over-month basis, the U.S. National Index declined 0.1% before seasonal adjustment. At the same time, the 10-City Composite inched up 0.1%, while the 20-City Composite edged down less than 0.1%. After seasonal adjustment, the U.S. National Index rose 0.4%, while the 10-City and 20-City Composites both grew 0.5%.
The combination of high financing costs and prices continue to cap growth. Before seasonal adjustment, 15 of the 20 major metro areas saw price declines in November. The Northeast and Midwest continue to outperform other regions as overall conditions cool. Meanwhile, in addition to Tampa, the Sun Belt and Western markets continue declining, including Phoenix (down 1.4%), Dallas (down 1.4%) and Miami (down 1.0%).
Any short-term momentum from last year has slowed across regions. Home price gains continue to trail inflation, weakening home values over the past year. The new equilibrium of minimal price growth and elevated costs is leaving home values essentially flat in real terms.
Confidence Measures Fall as Inflation and Labor Concerns Persist
Consumer confidence plummeted 9.7 points in January to 84.5, its lowest level since 2014. Among its components, the Present Situation Index and Expectations Index both declined as consumers’ concerns regarding the present situation and expectations for the future worsened.
The Present Situation Index, reflecting current business and labor market conditions, fell 9.9 points to 113.7. Meanwhile, the Expectations Index, which reflects consumers’ short-term outlook for income, business and labor market conditions, decreased 9.5 points to 65.1, remaining below the recession signal threshold of 80 since February 2025.
Views of the current labor market situation weakened, with 23.9% of consumers saying jobs were “plentiful,” down from December (27.5%), while 20.8% said jobs were “hard to get,” up from December (19.1%). Looking to the future, 28.5% expect fewer available jobs in the next six months, up from 26.0% the prior month, while 13.9% anticipate more jobs to be available, down from 17.4% the previous month.
Mentions of high prices and inflation, tariffs and trade, politics and the labor market continued to top the list of topics influencing consumers’ views of the economy. At the same time, mentions of health care and insurance and war edged higher in January. Consumers’ 12-month inflation expectations increased, and the proportion of consumers expecting interest rates to rise dipped in January. At the same time, the share of consumers who believe a recession is “very likely” over the next year ticked up, and the small share thinking the economy is already in a recession rose.
Buying plans for cars overall were flat in January, as purchasing plans for homes fell. Consumers’ plans for buying big-ticket items declined in January, with purchasing plans for household appliances and electronics decreasing in all categories except smartphones. Consumers’ intentions to purchase more services also dropped; however, restaurants, bars and take-out remain the top planned service spending category and continued to rise. Overall, consumers’ views of their current and future financial situation weakened in January.
Powell Points to Strong Economy Amid Mixed Signals on Future Rates
As anticipated, the Federal Open Market Committee maintained its interest rate target range at 3.50%–3.75% at its January meeting. In a change to its previous statement, the FOMC noted that economic activity has been expanding at a solid pace, while the unemployment rate has shown signs of stabilization, no longer necessitating a rate cut. On the other hand, two FOMC members—Stephen Miran and Christopher Waller—dissented, preferring to lower the target range by 25 basis points. In addition, at its annual organization meeting, the FOMC reaffirmed its “Statement on Longer-Run Goals and Monetary Policy Strategy,” which articulates its approach to monetary policy. The statement is identical to the version adopted in August 2025.
In the press conference following the meeting, Federal Reserve Chairman Jerome Powell noted that the economy goes into 2026 on a firm footing, with job gains staying low while inflation remains elevated. Chairman Powell noted that the FOMC is well positioned to determine the extent and timing of additional adjustments to its policy stance. In addition, the improved outlook for economic activity should have a positive impact on labor demand and employment.
The FOMC’s summary of economic projections, which maps out the Federal Reserve’s expectations for where interest rates may be headed in the future, generally is released in conjunction with every other FOMC meeting. Since the December meeting included a release of economic projections, there was not a release in conjunction with the January FOMC meeting. The December summary signaled a mixed stance regarding where monetary policy should go in 2026. Twelve Federal Reserve officials projected additional rate cuts across 2026, while four anticipated no additional rate cuts, and three predicted a 25-basis-point hike.
Final Demand Service Prices Jump While Goods Prices Remain Flat
The Producer Price Index for final demand (also known as wholesale prices) rose 0.5% over the month in December, after prices ticked up 0.2% in November. Over the year, producer prices moved up 3.0% in December, unchanged from November. Meanwhile, prices for final demand excluding foods, energy and trade services increased 0.4% over the month in December after rising 0.2% in November. Prices for these goods advanced 3.5% from December 2024.
Within final demand, prices for services jumped 0.7% in December after staying the same in November. Meanwhile, prices for goods stayed the same in December, after rising 0.8% in November. Within the final demand services index, margins for machinery and vehicle wholesaling moved up 4.5%, accounting for more than 40% of the December increase. Within the final demand goods index, prices for nonferrous metals climbed 4.5%, while prices for diesel fuel fell 14.6%.
Processed goods for intermediate demand inched down 0.1% in December, following a 0.5% increase in November. The decrease was driven by a 2.4% decline in the index for processed energy goods, in particular the drop in prices for diesel fuel. On the other hand, the index for processed materials less foods and energy advanced 0.7%. Over the year, the index rose 3.4% after a 0.1% increase in December 2024.
Meanwhile, prices for unprocessed goods for intermediate demand grew 2.3% in December, the largest increase since January 2025, after moving up 0.5% in November. The gain was led by a 34.8% jump in the index for natural gas. At the same time, prices for slaughter hogs declined 10.1%. Over the year, prices for unprocessed goods for intermediate demand decreased 0.3% after moving up the same amount in November.
Current Component Measures Weaken, While Future Expectations Strengthen
Manufacturing activity in the Fifth District contracted in January, but at a slightly slower pace than the previous month, with the composite manufacturing index inching up from -7 to -6. At the same time, the local business conditions index improved from -9 in December to -8 in January. Despite current weakness, manufacturers are more optimistic about the future, with the outlook for future local business conditions rising from 16 in December to 19 in January. The Fifth District consists of Virginia, Maryland, the Carolinas, the District of Columbia and most of West Virginia.
Among its components, shipments remained negative but contracted at a slower pace, increasing from -11 to -5. New orders improved slightly, ticking up from -8 to -6 in January. Employment worsened, falling from -1 to -6, and the vendor lead time index declined from 9 to 0. Meanwhile, the share of firms reporting backlogs worsened, decreasing from -7 to -13. The average growth rate of prices paid quickened, while average growth of prices received slowed in January.
Looking ahead, firms expect both price indexes to increase in the next 12 months, with both rising at a slightly faster pace than forecasted in December. Expectations for future shipments climbed from 28 to 34, while new orders increased from 27 to 36. Expectations for backlogs inched down from 5 to 4. Meanwhile, firms’ expectations about equipment and software spending turned negative, declining from 0 to -3. At the same time, expectations for capital expenditures improved but remained negative, increasing from -6 to -4. In sum, businesses in the Fifth District remain optimistic about future business conditions but pessimistic about future investment plans.
Texas Manufacturing Shows Renewed Strength Despite Mixed Signals
In January, Texas factory activity expanded notably after contracting the prior month. The production index increased from -3.0 to 11.2, moving above the series average of 9.6. The new orders and capacity utilization indexes also turned positive, rising 18.4 points to 11.8 and 11.7 points to 7.1, respectively. Meanwhile, shipments jumped 22.5 points to 12.0. The Eleventh District consists of all of Texas, northern Louisiana and southern New Mexico.
Consistent with the growth seen across indexes in January, perceptions of manufacturing business conditions strengthened, with the general business activity index increasing 10.1 points to -1.2. At the same time, the company outlook index rose 15.2 points to 2.9. On the other hand, the uncertainty index moved up 4.8 points from 0.0, remaining below the series average of 16.9.
Labor market indicators suggest strong growth in headcounts but almost no change in the workweek in January, with the employment index rising 9.6 points to 8.2 and the hours worked index stepping up 8.5 points to 0.7. Nearly 21.5% of firms reported net hiring, while a smaller percentage (13.3%) noted net layoffs.
Price pressures accelerated while wage pressures weakened in January. The prices paid for raw materials index inched up 1.9 points to 37.1. Meanwhile, the prices received for finished goods index jumped 9.7 points to 18.5, more than double the series average. The wage and benefits index decreased 4.3 points to 17.4, staying below the series average of 20.9.
The outlook for future manufacturing strengthened in January, despite the future production index declining 3.7 points to 29.2. Moreover, the future general business activity index and future company outlook index both moved up, increasing to 16.6 and 23.2, respectively.
What the Latest Data Show Across Manufacturing Sectors
New orders for manufactured goods increased 2.7% in November, following a 1.2% decline in October. Meanwhile, new orders for manufactured goods grew 3.4% over the year. When excluding transportation, new orders inched up 0.2% over the month and 0.7% year-over-year in November. Orders for durable goods jumped 5.3%, following a 2.1% decrease in October. Year to date, durable goods orders rose 7.3%. Nondurable goods orders stayed the same in November after declining 0.3% in October. Nondurable goods orders edged down 0.3% over the year.
New orders for nondefense aircraft and parts led the increase in durable goods orders, surging 97.6%, following October’s 17.9% drop. In November, the largest monthly decrease occurred in defense search and navigation equipment, which fell 9.7% after increasing 2.5% the prior month. The largest over-the-year changes occurred in nondefense aircraft and parts (up 111.8%) and mining, oil field and gas field machinery (down 6.8%).
Factory shipments declined 0.1% in November, after ticking up 0.1% in October. Shipments over the year rose 1.5%. Shipments excluding transportation increased 0.2% in November, following a 0.1% decrease the previous month. Shipments for durable goods dropped 0.3% in November, following a 0.5% rise in October, and are up 3.3% year to date. Meanwhile, nondurable goods shipments stayed the same after moving down 0.3% the prior month, and are down the same amount year to date.
Unfilled orders for all manufacturing industries increased 1.4% in November, after inching up 0.2% in October. Unfilled orders over the year jumped 9.4%. Inventories rose 1.1% year-over-year. The inventories-to-shipments ratio remained unchanged at 1.56 in November. The unfilled orders-to-shipments ratio for durable goods moved up to 7.04 in November from 6.93 in October.
Manufacturers Take Permitting Case to Senate EPW
The NAM continues its full-court press for comprehensive, bipartisan permitting reform on Capitol Hill, urging the leaders of the Senate Committee on Environment and Public Works to consider manufacturers’ key priorities ahead of a hearing on environmental review and permitting processes.
- “Manufacturers strongly support getting permitting reform done this year to provide clarity across all types of investments that will grow jobs here at home and ensure America continues to compete and lead on the world stage.”
Building on House momentum: The NAM ramped up its decades-long effort to secure permitting reform at the end of last year and is keeping its momentum going after promising results in the House in mid-December. Now it is urging the Senate to follow suit on these key issues:
- Reforming the National Environmental Policy Act: The NEPA process is often used in ways not intended by Congress—leading to significant delays and uncertainty for manufacturers. The NAM supports expediting judicial review with workable statute of limitations and guardrails on judicial vacatur, expanding categorical exclusions, codifying Supreme Court precedent to ensure NEPA’s scope is focused appropriately on proximate and project-specific impacts and ensuring there are enforceable statutory deadlines for agencies.
- Clarifying what triggers a federal action: Federal incentives should expedite manufacturing projects, not slow them down. Manufacturers believe that the NEPA process should not be triggered automatically by the grant of federal financial support, but rather depend on an analysis of the potential impacts of a project.
- Modernizing the Clean Air Act: Manufacturers support a modernized National Ambient Air Quality Standards process and review cycle, allowing for expanded emissions credit trading, discounting emissions from international and exceptional event sources, like wildfires and wildfire-mitigation efforts, when setting compliance burdens and right-sizing the New Source Review program to allow projects to get shovels in the ground quicker before installing emitting equipment.
- Streamlining the Clean Water Act: Policymakers should clarify timelines for when agencies must act on permitting requests, establish clear, commonsense definitions regarding the scope of permitting and consultation requirements and increase the use of general permits.
- Providing greater certainty to lawfully permitted projects: Manufacturers should also receive statutorily equal protection for permits of all types, so they can plan and invest over the long term. Policymakers should use oversight authority to ensure federal agencies are coordinating fully during permitting and a lead agency is always designated.
- Accelerating energy infrastructure buildout: With demand for energy skyrocketing, U.S. infrastructure must be upgraded and expanded. The NAM supports modernizing the permitting and safety processes for pipelines and ensuring federal coordination with states and localities as they install new electric transmission and distribution lines.
- Unlocking access to domestic critical materials: Lawmakers should ensure that any comprehensive permitting deal will expedite the approval of critical minerals and materials projects, including aligning the Department of Energy’s Critical Materials and the Department of the Interior’s Critical Minerals Lists.
The last word: “Manufacturers in America create family-supporting jobs in communities across the country, drive innovation, power economic growth and develop and deploy technologies to make our environment cleaner,” said NAM Vice President of Domestic Policy Chris Phalen.
- “This Congress has made it clear that new policies are needed to ensure the United States becomes the destination of choice for new manufacturing investment so that our nation can maintain our leadership in creating new technologies and products that make lives better for people around the world.”