
What the Latest Data Show Across Manufacturing Sectors
New orders for manufactured goods increased 2.7% in November, following a 1.2% decline in October. Meanwhile, new orders for manufactured goods grew 3.4% over the year. When excluding transportation, new orders inched up 0.2% over the month and 0.7% year-over-year in November. Orders for durable goods jumped 5.3%, following a 2.1% decrease in October. Year to date, durable goods orders rose 7.3%. Nondurable goods orders stayed the same in November after declining 0.3% in October. Nondurable goods orders edged down 0.3% over the year.
New orders for nondefense aircraft and parts led the increase in durable goods orders, surging 97.6%, following October’s 17.9% drop. In November, the largest monthly decrease occurred in defense search and navigation equipment, which fell 9.7% after increasing 2.5% the prior month. The largest over-the-year changes occurred in nondefense aircraft and parts (up 111.8%) and mining, oil field and gas field machinery (down 6.8%).
Factory shipments declined 0.1% in November, after ticking up 0.1% in October. Shipments over the year rose 1.5%. Shipments excluding transportation increased 0.2% in November, following a 0.1% decrease the previous month. Shipments for durable goods dropped 0.3% in November, following a 0.5% rise in October, and are up 3.3% year to date. Meanwhile, nondurable goods shipments stayed the same after moving down 0.3% the prior month, and are down the same amount year to date.
Unfilled orders for all manufacturing industries increased 1.4% in November, after inching up 0.2% in October. Unfilled orders over the year jumped 9.4%. Inventories rose 1.1% year-over-year. The inventories-to-shipments ratio remained unchanged at 1.56 in November. The unfilled orders-to-shipments ratio for durable goods moved up to 7.04 in November from 6.93 in October.
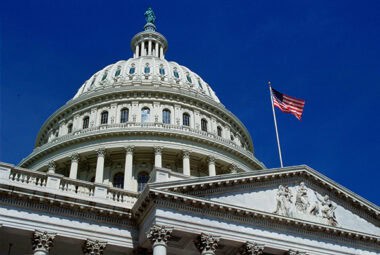
Manufacturers Take Permitting Case to Senate EPW
The NAM continues its full-court press for comprehensive, bipartisan permitting reform on Capitol Hill, urging the leaders of the Senate Committee on Environment and Public Works to consider manufacturers’ key priorities ahead of a hearing on environmental review and permitting processes.
- “Manufacturers strongly support getting permitting reform done this year to provide clarity across all types of investments that will grow jobs here at home and ensure America continues to compete and lead on the world stage.”
Building on House momentum: The NAM ramped up its decades-long effort to secure permitting reform at the end of last year and is keeping its momentum going after promising results in the House in mid-December. Now it is urging the Senate to follow suit on these key issues:
- Reforming the National Environmental Policy Act: The NEPA process is often used in ways not intended by Congress—leading to significant delays and uncertainty for manufacturers. The NAM supports expediting judicial review with workable statute of limitations and guardrails on judicial vacatur, expanding categorical exclusions, codifying Supreme Court precedent to ensure NEPA’s scope is focused appropriately on proximate and project-specific impacts and ensuring there are enforceable statutory deadlines for agencies.
- Clarifying what triggers a federal action: Federal incentives should expedite manufacturing projects, not slow them down. Manufacturers believe that the NEPA process should not be triggered automatically by the grant of federal financial support, but rather depend on an analysis of the potential impacts of a project.
- Modernizing the Clean Air Act: Manufacturers support a modernized National Ambient Air Quality Standards process and review cycle, allowing for expanded emissions credit trading, discounting emissions from international and exceptional event sources, like wildfires and wildfire-mitigation efforts, when setting compliance burdens and right-sizing the New Source Review program to allow projects to get shovels in the ground quicker before installing emitting equipment.
- Streamlining the Clean Water Act: Policymakers should clarify timelines for when agencies must act on permitting requests, establish clear, commonsense definitions regarding the scope of permitting and consultation requirements and increase the use of general permits.
- Providing greater certainty to lawfully permitted projects: Manufacturers should also receive statutorily equal protection for permits of all types, so they can plan and invest over the long term. Policymakers should use oversight authority to ensure federal agencies are coordinating fully during permitting and a lead agency is always designated.
- Accelerating energy infrastructure buildout: With demand for energy skyrocketing, U.S. infrastructure must be upgraded and expanded. The NAM supports modernizing the permitting and safety processes for pipelines and ensuring federal coordination with states and localities as they install new electric transmission and distribution lines.
- Unlocking access to domestic critical materials: Lawmakers should ensure that any comprehensive permitting deal will expedite the approval of critical minerals and materials projects, including aligning the Department of Energy’s Critical Materials and the Department of the Interior’s Critical Minerals Lists.
The last word: “Manufacturers in America create family-supporting jobs in communities across the country, drive innovation, power economic growth and develop and deploy technologies to make our environment cleaner,” said NAM Vice President of Domestic Policy Chris Phalen.
- “This Congress has made it clear that new policies are needed to ensure the United States becomes the destination of choice for new manufacturing investment so that our nation can maintain our leadership in creating new technologies and products that make lives better for people around the world.”
Manufacturers: Congress Must Act to Lower Health Care Costs

Ahead of two hearings focused on health care affordability, the NAM laid out manufacturers’ policy solutions to reduce health care costs for manufacturers, their workers and their families.
The hearings: The House Committee on Ways and Means and the House Energy and Commerce Subcommittee on Health each held a hearing with the CEOs of major health insurance companies as witnesses on Jan. 22. House Ways and Means Committee Chair Jason Smith (R-MO) summed up the reason for the hearings in his opening statement, stating, “patients are forced to navigate systems designed around insurer priorities, not patient needs.”
Why manufacturers care: Seventy percent of manufacturers cited health care and insurance costs as a primary business concern in the NAM’s most recent Manufacturers’ Outlook Survey.
- Ninety-four percent of manufacturers also said that they expected, or had already seen, an increase in health insurance premiums for 2026. Of those, 11% see premiums rising by more than 20%, an unsustainable increase that neither manufacturers nor manufacturing workers and their families can afford.
What’s needed: To address the steep and sustained increase in health care costs, the NAM recommended that policymakers focus on certain reforms, including the following:
- PBM reform: Pharmacy benefit managers, the unregulated middlemen that negotiate and administer drug benefits for health insurance companies and self-funded employer plans, have long driven up the costs of medicine by pocketing manufacturers’ rebates and engaging in other questionable business practices. Necessary reforms include increasing transparency requirements, delinking PBM compensation from the list price of medicines and instituting full rebate passthrough to plans and their beneficiaries in the commercial market. PBM reforms were included in the House-passed government funding bill, which awaits consideration in the Senate.
- 340B program reform: The 340B program was created to lower costs for underserved and low-income patients, but has expanded far beyond Congress’ intent. The 340B program allows certain hospitals and clinics to buy drugs at lower prices, but when patients with health insurance through their employer receive those drugs, their insurance is charged the full price and patients and employers lose out on negotiated rebates. Reforms are needed to return the program to Congress’ original intent and put more money in the pockets of manufacturers.
- HSA expansion: Congress should consider expanding eligibility and contribution limits for health savings accounts, tax-free savings accounts that patients with certain health insurance plans can use to pay for out-of-pocket medical costs. Expanding eligibility and contribution limits for HSAs would help more Americans pay their out-of-pocket health care costs tax-free.
Other recommendations: The NAM also recommended ways to help manufacturers continue to offer health benefits to their workers, including incentivizing the adoption of individual coverage health reimbursement arrangements (which allow employers to make tax-free reimbursements to employees for qualified medical expenses without providing traditional group health insurance), codifying association health plans (which allow small employers to join together to offer employer-sponsored health plans at lower costs than they could individually) and improving data transparency and accessibility for employer plan sponsors.
- The NAM also urged policymakers to strengthen the Employee Retirement Income Security Act of 1974 and protect its federal preemption so manufacturers can continue to provide consistent, yet tailored, benefits across many states.
The last word: “Manufacturers and their workers are increasingly concerned with the rising cost of health care,” said NAM Director of Health Care Policy Jess Wysocky and NAM Vice President of Domestic Policy Jake Kuhns. “Congress must act to reduce health care costs so that manufacturers can continue to offer health insurance to their workers, and their families, who work hard every day to power the American economy.”
Commerce Department Injects $1.6 Billion into Domestic Rare Earths

The U.S. government is putting $1.6 billion behind USA Rare Earth, the company announced this week, as part of a broader push to strengthen domestic critical supply chains and reduce reliance on China (The Wall Street Journal, subscription).
What’s going on: USA Rare Earth “said Monday that the nonbinding letter of intent from the Commerce Department’s CHIPS Program would cover a proposed $1.3 billion senior secured loan, alongside $277 million in proposed federal funding.”
- Under the agreement—part of the administration’s effort to build a stronger domestic rare-earths supply chain—the company will give the Commerce Department 16.1 million shares and approximately 17.6 million warrants.
- The news follows the announcement in November that rare-earth magnets company Vulcan Elements received a $620 million Defense Department loan, along with $50 million from the Commerce Department.
- The U.S. government has also taken stakes in rare-earths miner MP Materials.
Why it’s crucial: “The flurry of investment follows China restricting its rare-earth exports in April, putting pressure on the government and U.S. businesses to meet mineral demand from defense contractors and other manufacturers.”
Well-positioned: USA Rare Earth has raised an additional $1.5 billion in private investment, it said.
- It’s also signed a letter of intent with the Energy Department’s National Energy Technology Laboratory, under which the lab will help it develop “digital twin technology to improve the company’s rare-earth elements separation processes.”
The Manufacturing Institute Launches New FAME Chapter in Iowa

The Manufacturing Institute—the workforce development and education affiliate of the NAM—is launching a new chapter of the Federation for Advanced Manufacturing Education (FAME USA) in partnership with Grow Quad Cities and Eastern Iowa Community Colleges.
- FAME USA, which was founded by Toyota and is now led by the MI, is an employer-led solution that provides global-best workforce development through strong technical training, integration of manufacturing core competencies, intensive professional practices and intentional hands-on experience.
How it works: The new two-year apprenticeship-style training program at EICC—the product of two years of research by the MI and partners into local workforce needs—will allow students to earn while they learn to become highly skilled advanced maintenance technicians.
- Students spend two days a week in the classroom and three days a week with a sponsoring employer to get hands-on experience on the shop floor. At the end of their two years, they will have accrued over 2,000 hours of hands-on training and earned an associate degree in industrial maintenance.
- The new IA FAME – Riverbend chapter will be housed at EICC’s Blong Technology Center in partnership with Grow Quad Cities and seven local manufacturing companies: Amcor Global Rigid Packaging Solutions, LMT Defense, Novelis, Oertel Metal Works, PCT Ebeam and Integration, Smith Filter and SSAB.
- “Riverbend FAME expands what’s possible for students,” said EICC Chancellor Bryan Renfro. “It gives them a direct pathway to industry experience, job-ready training and long-term career success in manufacturing.”
Why it matters: Grow Quad Cities’ annual Top 100 High-Priority Jobs Report, released in August 2025, shows high local demand for industrial machinery mechanics, machinists and mobile heavy equipment mechanics—roles for which FAME graduates are perfectly suited.
- “We’ve been thoughtfully listening to what our local manufacturers need when it comes to future workforce,” said Grow Quad Cities Vice President, Business Retention & Expansion, Workforce Chris Caves. “And we know the need for maintenance talent in the region is growing due to an aging population of maintenance staff. FAME has been adopted positively by global manufacturing companies for the past 15 years, and we’re ready to demonstrate that the Quad Cities is serious about developing manufacturing professionals to satisfy this occupational need that will only grow in the years to come.”
- With support from the Arconic Foundation, the MI advanced its FAME efforts by partnering with Grow Quad Cities to convene local employers and launch the newest FAME chapter, strengthening workforce development for the Quad Cities’ robust manufacturing community.
Critical support: The new chapter was made possible thanks to grants from the Arconic Foundation.
- “The newly established FAME chapter serving the Quad Cities region will open new paths to great careers in manufacturing for local students,” said Arconic Foundation President and Treasurer Ryan Kish. “Arconic Foundation is proud to invest in this proven model to help prepare the next generation of manufacturing workers in the community.”
FAME spreads: IA FAME – Riverbend is the first FAME chapter in Iowa, expanding FAME USA’s footprint to 17 states, with 45 locations nationwide.
- As of 2025, six years after the MI took over responsibility for the initiative, FAME has brought together nearly 500 companies employing more than 1,200 students annually with 2,700 graduates and growing.
- FAME USA National Director Tony Davis said, “This chapter is really a great example of perseverance and engagement from local manufacturers, supported by great community groups and with a commitment to serve the needs of manufacturers by the college.”
What’s next: The first cohort of 10 students will start in fall 2026 and will graduate ready to join the manufacturing workforce full time in spring 2028.
Get involved: To learn more about FAME and starting a chapter, go here.
Photo of EICC Chancellor Bryan Renfro, credit EICC
CRH Americas President: Infrastructure Needs Congress’ Attention

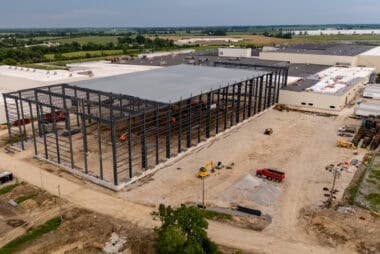
As manufacturers build and expand U.S. facilities and data centers spring up around the country, investing in modernizing America’s infrastructure has never been more urgent, according to CRH Americas Division President Nathan Creech—especially as dedicated federal transportation funds are set to expire in September.
By the numbers: “Industrial facilities—dozens of which are being stood up each month—generate up to 163 times more daily traffic than residential neighborhoods. Heavy commercial vehicles, the backbone of modern supply chains, cause up to 1,400 times more pavement damage than passenger cars. Modern fulfillment centers generate five times more traffic than traditional warehouses,” Creech wrote in the Washington Reporter this month.
- “Every factory America builds, and every supply chain we onshore, places even greater demands on roads and bridges that are already stretched to their limits,” he warned.
The price of disrepair: “The repair costs our nation faces are equally unforgiving. Nearly half of America’s major roads are in poor or mediocre condition, with a funding gap approaching $1 trillion over the next decade,” wrote Creech.
- “This poor infrastructure costs the average motorist $725 annually in vehicle damage and lost time—a hidden tax on working Americans, paid year after year in visits to the mechanic, high-volume traffic and endless frustration.”
- By contrast, “Every dollar spent on roads and bridge modernization generates $1.50 to $3.50 in economic activity.”
The policy prescription: The next infrastructure bill should be more focused than previous efforts, Creech advised policymakers, prioritizing the maintenance and modernization of existing roads and bridges. He also stressed the importance of streamlining the permitting process, enabling more infrastructure projects to get going faster.
The last word: “We cannot build a 21st-century economy on 20th-century roads. Without decisive action, our efforts to reindustrialize America will overwhelm the roads, highways and bridges across the country that were designed for a previous era,” Creech concluded.
- “As we approach the 250th anniversary of the United States, what better way to invest in the future of our great nation than to rebuild the roads and bridges that form the backbone of America.”
The NAM says: “Better infrastructure fuels greater manufacturing output, and greater manufacturing output drives the need for continued infrastructure investment, growing our economy. Simply put, an investment in our infrastructure is an investment in manufacturing,” said NAM Vice President of Domestic Policy Chris Phalen.
Terrorism Risk Insurance Act Extension Clears House Committee
The House advanced a bill yesterday that would extend the Terrorism Risk Insurance Act, an important safeguard for manufacturers and other businesses (Insurance Journal).
The background: “A federal backstop for terrorism risk was first initiated late in 2002 by the Terrorism Risk Insurance Act to respond to insurers’ exclusions of terrorism risks from commercial property/casualty insurance policies following losses from 9/11.”
- The bill, sponsored by Rep. Mike Flood (R-NE) and cosponsored by Rep. Andrew Garbarino (R-NY), would extend the terrorism insurance program for seven years. The House Financial Services Committee voted 51-2 on Thursday to advance this bill to the House floor.
NAM in action: The NAM is a member of the Coalition to Insure Against Terrorism, a group of commercial insurance consumers from many sectors, which supports the extension. This week, the coalition sent a letter to committee leaders urging them to advance this legislation.
- “For more than 20 years—and through multiple reauthorizations—Congress has recognized TRIA’s essential role in sustaining a viable terrorism risk insurance market,” the coalition said.
- “This seven-year reauthorization will provide long-term certainty for that marketplace. Acting in 2026 will also prevent the uncertainty and potential market disruptions that have occurred when reauthorization extends into the final year of an existing authorization.”
The NAM says: After the bill was approved, the NAM wrote on social media: “Manufacturers thank [the committee] for passing H.R. 7128, by Rep. Mike Flood, to extend the TRIA program, providing much-needed certainty to businesses by ensuring they can continue to obtain insurance against acts of terrorism.”
Other advances: The Financial Services Committee also advanced legislation that would repeal the Securities and Exchange Commission’s conflict minerals rule, another NAM priority.
- In response, NAM Managing Vice President of Policy Charles Crain wrote, “The SEC’s conflict minerals rule is a costly corporate disclosure mandate that diverts the resources of manufacturers from important investments in R&D, new equipment and jobs. Manufacturers thank the committee and Rep. [Bill] Huizenga [R-MI] for advancing H.R. 7085 to repeal this burdensome rule.”
- The committee also approved H.R. 6967, a bipartisan bill introduced by Reps. Frank Lucas (R-OK) and Brittany Pettersen (D-CO), to establish a Public Company Advisory Committee at the SEC to represent the views of companies.
- “Manufacturers thank Reps. Lucas and Pettersen for their leadership to facilitate capital formation with the creation of a committee at the SEC that will give publicly traded manufacturers a greater voice in rulemaking and SEC priorities,” Crain wrote on social media.
NAM: Congress Should Modernize TSCA

Manufacturers have been closely involved in the implementation of the Toxic Substances Control Act, and they know how it ought to be revised and improved, the NAM told the House Energy and Commerce Subcommittee on Environment this week.
Why it matters: “The responsible use and management of chemicals is critical for manufacturers because it directly affects the safety of workers in facilities, consumers of products being made and the communities in which facilities operate,” the NAM said.
Why now? The TSCA’s fee authority, established in 2016 under the bipartisan Frank R. Lautenberg Chemical Safety for the 21st Century Act, expires in September. The fee authority supports the Environmental Protection Agency’s expanded responsibility under the Lautenberg Amendments for approving chemistries used by manufacturers throughout the supply chain.
- Policymakers are considering reforming the TSCA alongside renewing the fee authority, and the subcommittee held a hearing about draft legislation on Thursday.
What Congress should do: Along with reauthorizing the fee authority, policymakers should make the following improvements to the TSCA, the NAM recommended:
- Improve timeliness and predictability of review processes so regulated entities can plan investments and compliance with confidence
- Ensure a risk-based approach that reflects real-world exposure and use conditions, uses sound science and transparent assumptions and ensures decisions are durable and defensible
- Support effective and efficient coordination across federal programs to reduce duplicative requirements and support meaningful regulatory outcomes
The last word: “Manufacturers strongly support the Energy and Commerce Committee’s efforts to improve the TSCA while extending TSCA fee authority,” said NAM Director of Chemicals, Materials and Sustainability Policy Reagan Giesenschlag and NAM Vice President of Domestic Policy Chris Phalen.
- “Targeted improvements that enhance program efficiency, predictability and certainty will help unlock manufacturing investment, strengthen domestic supply chains and support American competitiveness—while continuing to protect public health and the environment.”
NAM-Backed PBM Reform Passes House as Part of Spending Package

The NAM has long advocated for pharmacy benefit manager reform, a top health care priority for manufacturers. Crucial NAM-supported PBM priorities were included in the spending bill that passed the House yesterday by a wide bipartisan margin (Fierce Healthcare).
What it does: The bill—which arrives as a Jan. 30 funding deadline looms—delinks PBM compensation from medicine list prices in Medicare and bans spread pricing in Medicaid.
- PBM reform is a longtime top priority of the NAM, and lawmakers have been working on a compromise on the issue for months.
- Also in the bill are PBM reforms for commercial plans—including needed transparency provisions, which will help manufacturers better manage and predict health care costs, and full rebate passthrough, which will return resources to manufacturers and put money back into the pockets of their employees.
The NAM says: The NAM drove the inclusion of PBM reform in the package, writing to House and Senate leaders (and highlighting the issue on social media).
- The NAM told policymakers that “Seventy percent of manufacturers cited health care and insurance costs as their primary business concern in the NAM’s most recent Manufacturers’ Outlook Survey. Increased costs are impacting small and medium-sized manufacturers disproportionately, with 77.3% of small (fewer than 50 employees) and 76.6% of medium-sized (50 to 499 employees) companies identifying health care costs as their top concern.”
- “Manufacturers … greatly appreciate the timely inclusion of solutions in H.R. 7148 to address this critical issue. The NAM looks forward to continuing its work with Congress to ensure manufacturers of all sizes can continue offering health insurance to their workers, and their families, who work hard every day to power the American economy.”
NAM Announces New Leaders for Council of Manufacturing Associations
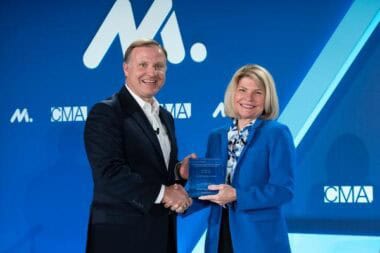
Following the CMA 2026 Winter Leadership Conference, the NAM announced new leadership for its Council of Manufacturing Associations. Corey Rosenbusch, president and CEO of The Fertilizer Institute, will take over as chair, and Kelly Mariotti, president and CEO of the Association of Home Appliance Manufacturers, will serve as vice chair.
The background: The CMA is made up of over 200 industry-specific manufacturing associations representing 130,000 companies and works with the NAM to build partnership and collaboration across the manufacturing industry and larger business community.
What they’re saying: “Manufacturers are doing what we’ve always done: pioneering innovation, powering the economy and responding to dynamic markets,” said Rosenbusch.
- “There’s no better time to be in manufacturing, and I’m thrilled—and honored—to lead the CMA as manufacturers navigate a new era in our industry. The mission of the CMA has never been more important. I hope that in this position I can illustrate the vital role manufacturing plays across every segment of the U.S. economy.”
The NAM says: “Corey and Kelly are proven, respected leaders, and both of them have demonstrated a deep dedication to the CMA’s mission and growth,” said NAM President and CEO Jay Timmons.
- “I’m grateful they’ve agreed to step into these leadership roles during a pivotal time for our industry. With Corey and Kelly’s partnership, manufacturers will build on our momentum after our recent success in securing pro-growth tax reform—and we will advance a comprehensive manufacturing strategy that unlocks opportunities for every sector represented in the CMA and for every manufacturer across the United States.”
Other appointments: The CMA also appointed new members to the 2026 board:
- Frank Hugelmeyer, president and CEO, National Marine Manufacturers Association
- Matt Seaholm, president and CEO, The Plastics Industry Association
- Megan Tanel, president and CEO, Association of Equipment Manufacturers