Business Community to Congress: Keep Funding ENERGY STAR

Congress should continue funding the federal ENERGY STAR program in fiscal year 2027 at FY2026 levels, 30 business groups including the NAM said this week.
What’s going on: “Explicit ENERGY STAR funding should again be included in the text of appropriations legislation,” the multi-industry coalition told House and Senate leadership on Tuesday, urging lawmakers to include in the FY2027 spending bill “key elements” achieved in the 2026 measure.
- “For [FY2027], the amount should consolidate past funding ($33M – $36M) expressly given to the Environmental Protection Agency, plus amounts used by the Department of Energy historically to run its portion of the program,” the coalition said.
- Leadership of ENERGY STAR, a voluntary program that promotes energy efficiency in consumer products, was redesignated last month from the EPA to the DOE. The coalition supported the move.
- In January, following steady NAM advocacy, Congress approved legislation to fully fund the program at $33 million for FY2026.
Why it’s important: “This public–private partnership drives the critical bipartisan objective of energy affordability,” the coalition said, citing the more than $500 billion in energy costs that, since its founding in 1992, the program has helped U.S. families and businesses save.
- “In 2020 alone, ENERGY STAR saved the equivalent of approximately 47 million homes’ energy use for a year. Considering the $33 million appropriated for ENERGY STAR in the very text of the [FY2026] spending bill (H.R. 6938), taxpayers receive a tremendous return on their investment for this program.”
The final say: Continuing FY2027 appropriations for ENERGY STAR also aligns with the administration’s broader goals, the groups said.
- “Lowering costs through efficiency … supports broader competitiveness goals, including strengthening national defense, leading the world in AI and ensuring U.S. energy dominance.”
NAM Makes the Case for Permitting Reform, Energy Abundance, AI at CERAWeek

At the recent “Super Bowl of the energy industry,” otherwise known as CERAWeek by S&P Global, the NAM was on the ground with manufacturing leaders, policymakers and the media—reinforcing the need for energy abundance and permitting reform to power American growth. NAM President and CEO Jay Timmons made the rounds with reporters and energy podcasts to make the case.
“Hello Houston” talk show: Timmons spoke with Houston Public Media’s “Hello Houston” program to highlight the challenges manufacturers face because of America’s broken permitting process.
- “Right now in the United States, it takes 80% longer to get a permit authorized for a project like a manufacturing facility than it does in any other free market economy,” said Timmons. “It doesn’t make sense for a country that frankly does a lot of good things and does it right.”
- “What we’re seeing are Democrats and Republicans and the White House rally around this effort to reform our permitting process to make it more predictable, take away the duplicity and the duplication, shorten the time that legal challenges can occur and just give more predictability to companies that are trying to do the right thing.”
POLITICO: Timmons put permitting reform front and center when talking to the media, telling POLITICO that “permitting reform will bring certainty to energy projects of all types, and help avoid the swinging of the political pendulum that occurs every two to four years in this country,” (POLITICO’s E&E News, subscription).
“Energy Trade Show” podcast: On the OGGN’s “Energy Trade Show”—the world’s leading oil, gas and energy podcast network—Timmons discussed workforce policy, AI’s upside for manufacturers and permitting reform.
- About energy abundance, he said, “[Manufacturers] use a third of the nation’s energy; it’s a major cost input for [NAM] members. They want to know that we’re here looking out for their interests and ensuring that the policies are being put in place to develop more energy product here in this country—and make sure that we’re focused on the things that will make that happen.”
- Timmons explained the connection between AI, energy policy and workforce efforts, saying that one challenge in the AI rollout “is the energy that’s necessary to power those data centers … [and] once we are able to produce the energy, we actually have to transmit that energy to where it needs to go.” Secondly, he added, “[W]e have an obligation to train our future workforce on how to utilize AI most effectively so that we can increase productivity and efficiency here in this country.”
Ambassador Greer, Policymakers Visit First Solar
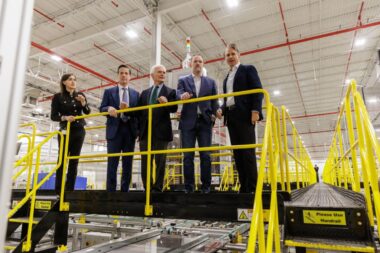
U.S. Trade Representative Jamieson Greer and several members of Congress visited the Ohio facilities of First Solar and Whirlpool last Friday during a tour of manufacturing plants.
Manufacturers’ strength: Following the visit, Greer joined CNBC’s “Squawk Box,” from First Solar’s R&D and manufacturing campus, spotlighting the manufacturers he toured while emphasizing the importance of building up the sector in the U.S.
- “We need people making stuff,” he said. “We need making it here… [W]hen you lose manufacturing, you lose a lot of the economic security you have from having supply chains right here in America.”
- “So we do want these jobs, we want them in these communities. A factory like [First Solar’s] underpins not only the local economy but the families of the people who work here. So obviously we have to have these kinds of jobs.
- “[For] most OECD countries, manufacturing is about 16% of their GDP. In America, [it] is 10%, and that’s too low.”
Rep. Latta says: Rep. Bob Latta (R-OH), who attended the tour, said, “When companies like First Solar and Whirlpool invest in expanding American manufacturing, they create good-paying jobs, strengthen our supply chain resilience and help keep our nation competitive in Ohio and across the country.”
News coverage: POLITICO and its Morning Trade newsletter (both subscription) covered the visits.
What to Know About Tariff Refund Claims
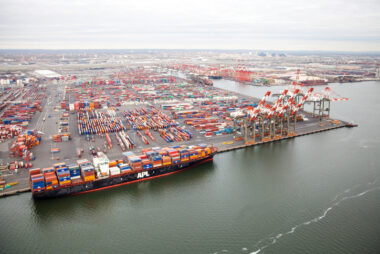
Customs and Border Protection has issued instructions for importers seeking to submit International Emergency Economic Powers Act tariff refund requests using the agency’s new automated system. Importers of Record and brokers can start submitting claims on April 20—after which the system will validate claims and pay out refunds and interest together in lump sums.
Here’s what manufacturers should know about the process.
How the system works: The new Consolidated Administration and Processing of Entries system, as the name suggests, consolidates refunds instead of processing them on an entry-by-entry basis.
- The system will recalculate duties as if the IEEPA duties were never owed. A projected refund will be the difference between the duties, taxes and fees paid on the entry summary and the recalculated total.
Liquidated versus unliquidated: Once the mass processing is complete, unliquidated entries will be set to liquidate 45 days from the CAPE declaration acceptance date.
- The only exceptions will be entries in suspended, extended or under review liquidation status.
- Meanwhile, liquidated entry summaries will reliquidate the next business day.
Phase 1: At this stage in the deployment of the CAPE system, only unliquidated entries, and those that are up to 80 days past their liquidation date, will be processed.
- A number of more complex cases won’t be processed until later in the rollout, as will other liquidated entries.
The wait: According to CBP, valid Phase 1 IEEPA refunds will be issued within 60 to 90 days following acceptance of a CAPE declaration—unless a compliance concern activates further CBP review.
- As mentioned earlier, individual entry refunds will be consolidated and paid in one lump sum.
- In addition, any unpaid debts to CBP will be deducted from the refund.
Learn more: CBP will maintain updated information about the rollout on its site.
Manufacturers Invest Billions in Workforce Training

Manufacturers continue to invest enormous sums in external and internal programs that boost workers’ skills, according to a new survey from the Manufacturing Institute—the workforce development and education affiliate of the NAM.
- “The State of Workforce Training in Manufacturing” survey was taken during the first quarter of 2026 and provided an update to the MI’s 2019 inaugural survey of human resources and operations leaders.
By the numbers: The MI estimates that manufacturers are spending $31.9 billion annually on internal and external training programs for new and existing manufacturing employees, up from $26.2 billion in 2019.
- In addition, new U.S. employees are estimated to receive 47.6 hours of in-house and external training on average, while existing employees receive an estimated 26.7 hours of training.
- About 77.5% of survey respondents said they offer employer-led training, a strength of the manufacturing industry.
A top concern: The challenge of attracting and retaining employees has long been a top business concern among manufacturers, landing at the top of respondents’ list 64% of the time in the NAM’s quarterly Manufacturers’ Outlook Surveys between 2018 and 2024.
- In the most recent survey, the Q1 2026 outlook survey, 44.7% of respondents cited this talent concern.
The MI says: “This updated survey demonstrates just how committed manufacturers are to building a skilled workforce,” said MI President Carolyn Lee. “You can see it in the data and see it in the creative approaches they have stood up to empower workers with the skills they need to thrive in manufacturing.”
- “Whether that’s through employer-led apprenticeship programs like the Federation for Advanced Manufacturing Education, reverse mentorships, additional on-the-job training or online certificate programs, manufacturers are continuing to invest in their people and their communities.”
- “As technological innovations and advancements continue to change how manufacturers do their jobs, the companies that continue to invest in training will reap outsized benefits.”
Sen. Lankford Champions Permanent Full Expensing
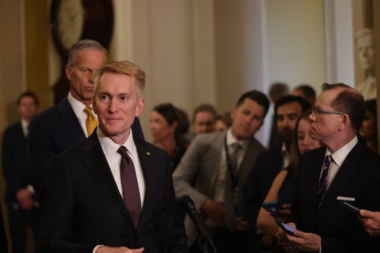
The NAM has been talking to manufacturers’ tax champions in Congress, who understand the importance of a fair, dependable tax code that promotes American competitiveness. This week, the NAM interviewed Sen. James Lankford (R-OK), a member of the Senate Finance Committee, who championed the bill in Congress to restore 100% bonus depreciation, which was included in H.R. 1, the landmark tax reform that made many key measures permanent.
Full expensing: When asked about the importance of permanent full expensing, Sen. Lankford replied, “Permanency is the difference between short-term tax relief and long-term economic certainty.”
- “Manufacturers are not making one-year decisions. They are making 10-, 20-, even 30-year capital allocation decisions on facilities, heavy equipment and production lines,” he added.
- “By making 100% expensing permanent, we are giving manufacturers confidence that the tax treatment will be consistent across the full lifecycle of an investment.”
- “That is why I have pushed for permanency through efforts like the ALIGN Act, which was included in the Working Families Tax Cuts Act, because pro-growth policy only works if businesses can rely on it over the long term,” he explained.
Impact on manufacturers: “What we are hearing, both in Oklahoma and across the country, is that the return to full expensing is beginning to unlock projects that were sitting on the sidelines,” Sen. Lankford said. “During the phase-down [which was eliminated by H.R. 1], when expensing dropped from 100% to 40%, many of those investments simply didn’t pencil out.”
- Oklahoma “is heavily concentrated in capital-intensive sectors like oil and gas, manufacturing and aerospace … [which] are exactly the types of industries where cost recovery drives investment decisions.”
- Now that full expensing has been restored, these companies are “moving forward on pipeline investments, placing new equipment orders and advancing plant and infrastructure upgrades. The key shift is that companies are no longer trying to time the tax code. They are making decisions based on operational need and long-term growth.”
Section 179: The NAM also asked Sen. Lankford about the increase of the Section 179 expensing cap from $1 million to $2.5 million and the expansion of bonus depreciation to manufacturing facilities. Sen. Lankford praised those provisions as well:
- “For smaller and mid-sized manufacturers, Section 179 is often the tool they use the most. … Increasing the cap means more of those everyday investments can be written off immediately, which helps with cash flow and makes it easier to keep reinvesting.”
- “The addition of expensing for manufacturing facilities is a big step forward. For a lot of companies, the building is one of the most expensive parts of the project, not just the equipment inside it,” he added.
The last word: Sen. Lankford emphasized that NAM members should get the word out about the favorable changes to the tax code:
- “It’s a simple but important message: if you’ve been holding off on a new piece of equipment, talk to your accountant now, because you may be able to write off the full cost this year,” he said.
- “Pro-growth policy only delivers if manufacturers know about it and use it, and that’s where NAM can make a real difference.”
Manufacturers Celebrate Pro-Growth Policies on Tax Day
On the first Tax Day since H.R. 1 passed, manufacturers are praising the pro-manufacturing policies that have supercharged their growth and provided them with the certainty they need to make big plans for the future.
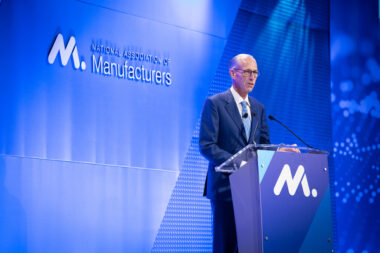
Timmons says: “This Tax Day, manufacturers now have a permanent, pro-growth tax code that allows our industry to compete and win,” said NAM President and CEO Jay Timmons.
- “Thanks to President Trump, leaders in his Cabinet and in Congress, the 2017 provisions of the Tax Cuts and Jobs Act were not just made permanent—they were made even stronger, which saved 6 million jobs.”
- “The tax and investment incentives in H.R. 1 amount to the most significant economic transformation in the history of our industry, serving as rocket fuel for manufacturers.”
Optimistic outlook: “Manufacturers’ optimism is on the rise, and they are ready to keep building, investing and leading—but that requires certainty across the board to take full advantage of H.R. 1’s transformative provisions,” Timmons continued.
- “President Trump and Congress went above and beyond to deliver tax certainty for manufacturers, and we look forward to continuing to work with them to build on this progress—ensuring certainty and lowering the cost of doing business—so that manufacturers can deliver the greatest manufacturing era in American history.”
Timmons and Emmer: Timmons and Rep. Tom Emmer (R-MN) teamed up for an op-ed in the Washington Examiner commemorating last year’s landmark tax law, noting, “Just one year ago, manufacturing leaders from across the country gathered on Capitol Hill alongside Treasury Secretary Scott Bessent and congressional leaders. Their message was clear: If the United States wants to lead, we must have a tax code that allows manufacturers to compete and win.”
- “When the right policies to reduce the cost of doing business in our country are in place, manufacturers can invest, hire and innovate at a scale that will define the next American century. The progress we are seeing today is proof of what works. This Tax Day, we should recommit to policies that unlock investment and keep America the best place in the world to build, create jobs and compete,” they concluded.
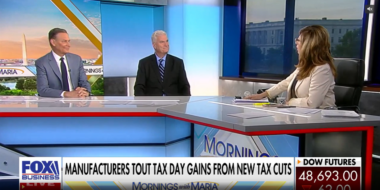
On TV: Timmons and Rep. Emmer joined “Mornings with Maria” on Fox Business Network this morning to talk about H.R. 1’s impact on manufacturing and manufacturers’ outlook.
- Timmons also went on Yahoo Finance’s “Market Domination” yesterday to spotlight manufacturers’ policy priorities including the benefits of competitive tax policy.
White House appreciation: A White House bulletin spotlighted three manufacturers’ stories about the benefits of tax reform, from Winthrop Tackle, Sukup Manufacturing Company and Allied PhotoChemical.
- White House Press Secretary Karoline Leavitt highlighted the Timmons and Rep. Emmer op-ed on social media.
Success stories: Check out the NAM’s tax policy page, featuring dozens of stories from manufacturers about the benefits that pro-manufacturing policies have brought to their companies.
The last word: “This Tax Day, the message is clear: when Washington gets the tax code right, manufacturers deliver,” Timmons said.
Timmons Congratulates Fitterling on Executive Chair Role
Former NAM Board Chair Jim Fitterling has been appointed executive chair of the Board of Dow Inc.—“an important leadership transition for the iconic manufacturer,” the NAM said yesterday.
A leader on policy: “Jim is a leader of substance and integrity—clear in his direction, consistent in his approach and deeply committed to the people and communities that power manufacturing,” said NAM President and CEO Jay Timmons.
- “As NAM Board chair, he helped strengthen the association’s impact and build consensus across the industry around a competitiveness agenda that is delivering results—from historic tax reform implementation to regulatory modernization and a growing consensus around permitting reform as essential to unlocking investment, jobs and growth in America.”
A leader on workforce: “Jim’s imprint on America’s future has extended well beyond policy. He has been a driving force behind efforts to inspire the next generation of manufacturers,” Timmons continued.
- “Through his leadership, the Creators Wanted campaign became the most successful workforce initiative in modern manufacturing history—reaching millions of students, parents and educators and changing perceptions about careers in our industry. He approached that work with a straightforward message: if you want to design, build and create, manufacturing offers that opportunity.”
- “He carried that same commitment into his strong support for the Manufacturing Institute as a respected advocate for bringing one’s authentic self to the workplace, helping broaden the impact of the MI in developing talent and opening doors for more Americans to pursue careers in modern manufacturing.”
A lasting record: “Jim leaves behind a stronger Dow, a more competitive manufacturing industry and meaningful progress in building the workforce that will define the future of manufacturing in the United States. On a personal level, he has been a trusted partner, counselor and a leader who consistently pushed for excellence and results on behalf of manufacturers.”
New leadership: “As we continue our historic charge with Jim as an Executive Committee member of the NAM, manufacturers congratulate Karen Carter on being named CEO of Dow,” Timmons concluded.
- “Karen is a proven and accomplished leader, and we look forward to working with her as she builds on Dow’s momentum and continues advancing manufacturing in the United States and around the world.”
Battery-Maker Antora Expands to Meet Soaring Demand

Thermal battery manufacturer Antora is growing rapidly to meet the demand for its products (The Mercury News, subscription).
What’s going on: This month, the company announced the completion of a two-building expansion of its San Jose, California, manufacturing campus, “a move that enabled [it] to more than double its space.”
- The firm, which makes energy storage technology that converts low-cost electricity into always-on heat and power, is “seeing unprecedented demand” for its technology, Antora Chief Operating Officer Justin Briggs told the news outlet. “Industrial electrification, data centers. We are really focused on data center expansion.”
- Antora now has over 100,000 square feet of manufacturing and operations space, up from just over 50,000.
Why it’s important: The energy stored in Antora’s thermal batteries “can be delivered 24/7 to manufacturers as affordable, reliable energy,” the NAM wrote in an original article in May 2025.
- “It’s a solution that is both modular and scalable, capable of serving small and large manufacturers alike.”
More online, faster: “We’ve already shipped gigawatt-hours of storage to industry in the Midwest, with more going out the factory door every day,” said Antora Co-Founder and Chief Commercial Officer David Bierman about the new expansion.
- “This expansion means that we can get major projects online faster—enabling the speed to power that this moment requires.”
The NAM’s view: “Antora’s batteries are manufactured in the U.S. and are a prime example of how we can avoid dependence on China for critical minerals,” said NAM Vice President of Domestic Policy Chris Phalen.
- “The company’s expansion is good news for the U.S., our energy and national security and our allies.”
Manufacturers Celebrate Anniversary of “Vaccination Day”

This week, manufacturers mark a defining 20th century triumph in engineering that saved countless lives and prevented unquantifiable suffering: the development and large-scale deployment of the polio vaccine. In an op-ed in The Washington Times, NAM President and CEO Jay Timmons reflects on Vaccination Day, sharing how the remarkable polio vaccine saved other children from the pain and debility his own grandmother suffered.
The celebration: “On April 12, 1960, President Dwight Eisenhower declared a victory the likes of which the United States had never before seen,” Timmons wrote.
- “Five years prior, during his presidency, the U.S. had announced that the polio vaccine—a genius innovation by Dr. Jonas Salk—was ready for widespread use.”
- “Eisenhower had masterminded the Allied victory in Europe, capped off on V-E Day. He knew what victory meant. That’s why it matters that in 1960, Eisenhower called upon the nation to ‘make April 12 a new kind of V-Day—vaccination day.’”
The disease: “Highly contagious and disproportionately affecting children, [polio] infected as many as tens of thousands of Americans in a single year.” Timmons continued.
- “Survivors of polio bore lasting scars: children who needed iron lungs to breathe, iron braces to stand or metal crutches to walk.”
Timmons’ grandmother: “Born in 1912, Jane contracted polio at age 2. Over her life, she learned how to walk four times: once before polio, a second time with leg braces, a third time as a teenager without any support (defying the experts) and a fourth time in her 50s, when—after years of pain from the lasting, debilitating effects of the disease—she submitted to a risky surgery,” Timmons wrote.
- “My grandmother was resilient and optimistic, a product of the Greatest Generation that won the war. The first time I ever saw her cry was when Eisenhower died. She knew, in so many ways, what he had helped free our world from.”
Triumph over suffering: “The vaccine meant children who would never lose their ability to walk. It meant parents and caregivers who could stay in the workforce. It meant employees who stayed healthy and produced more goods, products and opportunities for American communities. It meant businesses spared from the economic disruption that comes from widespread contagious diseases,” Timmons said.
- “The polio vaccine saved the American public more than $180 billion, and that’s just in treatment costs—to say nothing of the billions of dollars in economic activity it preserved.”
A modern-day triumph: Timmons also hailed President Trump’s Operation Warp Speed, which developed COVID-19 vaccines during his first term:
- “Like Eisenhower during polio, Mr. Trump during COVID-19 led with a belief in the lifesaving power of science and vaccines. He provided the competitive policies and the regulatory certainty that America needs to drive remarkable innovation. He worked to make sure life-changing discoveries were made in America and made it to the American people.”
The last word: “That is the formula for victories that would today be unimaginable to people such as my grandmother. We can bring debilitating diseases to an end. We can deliver the next V-Day,” Timmons concluded.
- “And as we mark America’s 250th anniversary, we can empower our nation’s manufacturers to drive the greatest standard of health and living in American history.”