Biogen’s Nicole Murphy Aims to Elevate the Manufacturing Workforce

Biogen Executive Vice President and Head of Pharmaceutical Operations and Technology Nicole Murphy has spent more than three decades building a career defined by service. As chair of the Manufacturing Institute’s 2026 STEP Ahead Awards, she brought that same philosophy to one of manufacturing’s biggest celebrations of leadership.
A high-impact role: Murphy started her career as an engineer on the shop floor of a chemical plant. She was quickly drawn to the complexity of process and product development, a passion that led her to biotechnology and, ultimately, to a career focused on improving lives.
- At Biogen, Murphy leads a team responsible for developing, making and delivering medicines at the highest level of quality that support the company’s portfolio in neurology, immunology and rare disease. Her team’s work spans from early preclinical development to clinical and commercial stages, helping ensure promising science reaches patients safely and reliably.
- “I tell people often that I have the best job in the world—and I truly believe it,” said Murphy.
A defining moment: For Murphy, the work is deeply personal. During a factory tour early in her career, she met a family whose 6-year-old daughter relied on the medicine produced by the facility. The girl’s older brother quietly told her, “Thank you for getting my sister out of her wheelchair and letting her play with me again.”
- “That day reinvigorated a sense of purpose that has stayed with me, day in and day out,” said Murphy. “It has pushed me to continue to ‘raise the bar’ because the hard work we do is nothing compared to what our patients persevere through.”
Mentorship is key: Murphy attributes her success to the many role models who have supported her career, including mentors and peers. They challenged her to leave her comfort zone by taking on new responsibilities, roles and projects—and helped her grow as a leader.
- She has since paid that forward. At Biogen, Murphy started a Reverse Mentorship program that flips the traditional mentor/mentee relationship, empowering employees at all levels to mentor senior leaders.
- “The intent is to strengthen working relationships, improve our understanding of employee experience—particularly through a lens of inclusion—and help leaders gain new perspectives,” said Murphy. The result is more effective leadership, stronger teams and a thriving culture, she says.
Her leadership philosophy: Murphy believes the strongest leaders listen first, take responsibility for setbacks and make sure their teams receive the credit for success.
- “Trust, purpose and community are absolutely foundational in building the best teams,” said Murphy.
The last word: “Manufacturing succeeds when we develop and elevate diverse talent, and STEP Ahead shines a light on leaders who are shaping the future of the industry,” said Murphy.
- “It is our workforce that will create the great next invention, ensure products and services reach the people who need them and inspire the generations to come.”
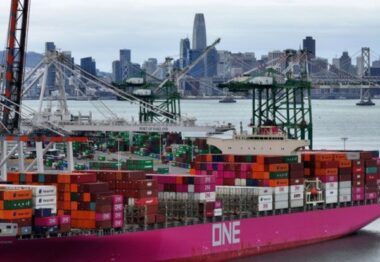
Amazon Launches New Supply Chain Business

Amazon has launched a new global business based on the internal logistics network it’s spent two decades building (The Wall Street Journal, subscription).
What’s going on: The company “is trying to do for logistics what its Amazon Web Services unit did for cloud computing with a new business called Amazon Supply Chain Services.”
- The new service, announced on Monday, is “a centralized place for companies from consumer-goods manufacturers to apparel retailers to hire Amazon for services such as fulfillment, ocean and air shipping, and truck transportation.”
Why it’s important: The move makes Amazon a third-party logistics provider and “positions [it] to take a bigger bite out of a global market for third-party logistics services that is estimated at more than $1.3 trillion.”
- In 2025, Amazon became the world’s largest 3PL firm based on gross logistics revenue.
What’s different about it: While Amazon businesses thus far “have largely been offered piecemeal,” the new offering will aim to fulfill customers’ “full supply chain needs.”
A marketplace opening: The new business comes at the right time for many companies, which have increasingly been outsourcing their logistics services in recent years as a way to save money and better manage disruptions.
What to Expect: Trump–Xi Meeting
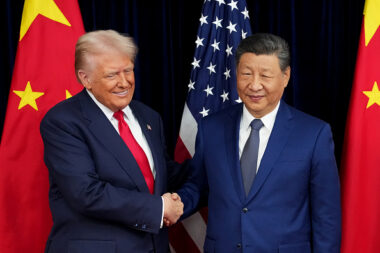
Presidents Trump and Xi will cover a wide array of topics at their meeting in China this week: Iran, Taiwan, nuclear weapons, artificial intelligence and rare earths, according to U.S. officials (Reuters, subscription).
What’s going on: Against the backdrop of a possible extension of a U.S.–China critical minerals deal, on Thursday and Friday “[t]he leaders of the world’s two largest economies will hold their first face-to-face talks in more than six months as they try to stabilize ties strained by trade, the U.S. and Israeli war with Iran and other areas of disagreement.”
- In what will be President Trump’s first China trip since 2017, the two nations “are expected to agree to forums to facilitate mutual trade and investment, while China is expected to announce purchases related to Boeing airplanes, American agriculture and energy.”
There’s more: Also potentially on the docket for the two-day meeting is a formal announcement of a Board of Trade and a Board of Investment.
- The former, a concept that came out of March U.S.–China talks, is a framework to expand trade and economic cooperation between the countries, while the latter is said to be for the management of investment disputes (The Wire China).
- However, the boards “may need subsequent work before they can be implemented, one of the officials said,” according to Reuters.
Rare earths: At the meeting, Presidents Trump and Xi could lengthen a trade-standoff truce that allows some rare earth minerals to be exported from China into the U.S.
- After imposing export controls on several rare earth elements in 2025, China suspended the restrictions for some rare earths but left others in effect.
“Thornier issues”: The presidents are also set to discuss Iran, Taiwan, AI and nuclear arms.
- China maintains ties with Iran, and President Trump has reportedly been urging China to press the regime in Tehran to accept a U.S. peace deal.
- “Xi, meanwhile, is frustrated with Washington over Taiwan. The U.S. remains the most important international backer and arms supplier for the democratically governed island, which Beijing claims as its own Chinese territory.”
- In addition, the Trump White House has “expressed increasing concern about advanced artificial intelligence models being developed in China.”
- Last, President Trump has long wanted to discuss nuclear weapons with President Xi, but Beijing “remains reluctant to discuss its arsenal.”
Rep. Miller Talks Tax Certainty with the NAM

As part of the NAM’s campaign to highlight the sweeping benefits of the 2025 tax law, which made permanent many crucial pro-manufacturing provisions, the NAM spoke to Rep. Carol Miller (R-WV) about her work in achieving tax certainty for manufacturers and all Americans.
Why it matters: “The Working Families Tax Cuts will deliver meaningful relief to American manufacturers, driving the development of new facilities, the creation of jobs and increased investment across the country,” said Rep. Miller.
- “The Ways and Means Supply Chain Tax Team focused on advancing pro-growth policies to fuel long-term economic prosperity,” she continued, discussing the legislative process that secured this victory for manufacturers.
- “Key provisions in the legislation—including permanent research and development expensing, full immediate expensing, a strengthened interest deduction and a 100% factory construction deduction—provide businesses with the certainty and incentives needed to plan, invest and compete globally,” she said.
The corporate rate: Rep. Miller singled out the lower corporate rate as essential to manufacturing competitiveness in the U.S., saying, “The preservation of the 21% corporate rate is critical in promoting American manufacturing because companies can invest in expanding infrastructure, purchase new equipment and increase workforce without tax liability uncertainty.”
- In addition, “The Working Families Tax Cuts compounded with bonus depreciation and immediate research expensing have proved to be effective for the industry, and we will continue to advocate for pro-growth policy that leads to new markets and more opportunities.”
Seeing the benefits: When asked about the impact of the Working Families Tax Cuts on her constituents, Rep. Miller said, “In my home district, we’ve seen these policies translate into new factories, new jobs and expanded opportunities.”
- “Companies like Conn-Weld Industries and Ferroglobe have used this tax relief to invest in their operations, grow their businesses and strengthen the local economy.”
What manufacturers should do: “NAM members should share their stories and voice their support for the Working Families Tax Cuts and communicate the real-world impact this legislation has on the country, their business and the employees and their families who benefit,” Rep. Miller urged.
- “Manufacturers are at the core of our economy and need a predictable and pro-growth tax code.”
Read the whole thing: You can find the full Q&A here.
Court Rules Against Section 122 Tariffs, Order Halted
A majority of the U.S. Court of International Trade ruled against President Trump’s 10% tariffs imposed under Section 122 of the Trade Act of 1974.
What happened: Two judges found in favor of the plaintiffs, focusing on what the 1974 Congress understood “balance-of-payments deficits” to mean.
- The plaintiffs argued the administration improperly focused on the nation’s “current account” to target trade deficits while ignoring other factors in the overall balance of payments, such as financial investment inflows.
- Because it ruled the administration’s analysis did not comport with this definition, it did not address other elements of the case, including whether the exemptions for USMCA-qualifying goods were lawful.
The relief: The court majority issued a permanent injunction, providing tariff relief for the state of Washington and the two private plaintiffs that are importers of record, and dismissing the claims of the remaining 23 U.S. states, who had not acted as importers and therefore lacked standing.
- Given the narrow scope of relief, other importers would need to file suits based on the same claims to seek an injunction.
Order halted: The Department of Justice filed a notice of appeal on May 8, asking the U.S. Court of Appeals for the Federal Circuit to overrule the CIT decision.
- In response, the Court of Appeals issued an administrative stay, and “set a schedule for both sides to file briefs on the longer-term delay issue in the coming two weeks” (Bloomberg Government).
- During those two weeks, the importers to whom the CIT ruling applies will continue to pay tariffs under Section 122.
Looking ahead: Section 122 tariffs are set to expire on July 24 unless extended by Congress.
Rep. Rouzer Talks Infrastructure with the NAM
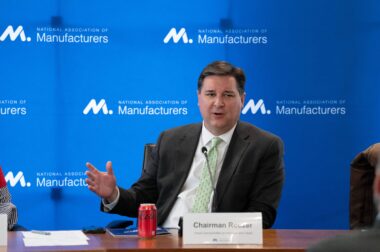
As part of the NAM’s national campaign to secure essential infrastructure legislation, we have been speaking with members of Congress about their legislative priorities. This week, we spoke with Rep. David Rouzer (R-NC) about his work promoting surface transportation reauthorization and its importance for his district.
The near term: Rep. Rouzer emphasized the importance of the upcoming surface transportation reauthorization bill, which will “achieve more timely project delivery, improved roadway safety and the strengthening of formula funding. …”
- “In my home state of North Carolina, and across the country, bottlenecks result in delay and additional costs for families, businesses and workers alike,” he continued. “That’s why I’m focused on commonsense permitting reform, better project delivery and giving states the funding certainty and flexibility they need to address their most pressing infrastructure challenges.”
The urgency: Rep. Rouzer noted that the current surface transportation law expires on Sept. 30. Passing it on time will provide “funding certainty” to states as they plan infrastructure projects, he said.
- In addition, “Congress has the responsibility to pass a strong, multiyear reauthorization bill to keep projects moving, ensure the sound stewardship of taxpayer dollars and strengthen the reliability of America’s transportation system.”
In North Carolina: When asked about the benefits of the bill for his constituents, Rep. Rouzer said that “Southeastern North Carolina depends on safe, efficient transportation to support its ports, coastal economy and the daily movement of people and goods to and from manufacturing hubs across the region…”
- “Good infrastructure also improves quality of life. Whether one is commuting to work, traveling between counties, getting supplies to a job site or evacuating during a hurricane, dependable roads and bridges matter,” he added.
Why the NAM matters: Rep. Rouzer concluded by emphasizing the importance of the NAM’s advocacy, in response to a question about the association’s role in helping get this bill passed. “The National Association of Manufacturers plays an important role by helping connect infrastructure policy to real-world needs of the economy,” he said.
- “I appreciate the NAM’s engagement to ensure all members of Congress understand the importance of a good and timely surface reauthorization bill that benefits their districts and the country as a whole. I look forward to our continued work together to achieve this.”
Sen. McCormick Introduces NAM-Backed Permitting Reform Legislation
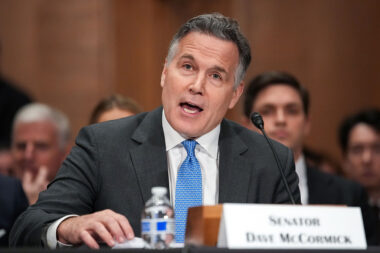
What’s going on: Sen. Dave McCormick (R-PA) last week unveiled the Unlock American Energy and Jobs Act, legislation that seeks to speed up the federal permitting process.
- “Today, more than 650 projects are currently listed on the federal Permitting Dashboard,” according to a news release from Sen. McCormick’s office. “Construction costs run 24–30% higher when projects are held up.”
- Permitting reform is a longtime NAM advocacy issue, and manufacturers have worked hand in hand with Congress to advance measures that will make building critical infrastructure in the U.S. easier, faster and less costly.
Why it’s important: The senator’s office cited a joint NAM–Foundation for American Innovation report that found “nearly 51% of manufacturers say permitting uncertainty discourages them from investing in new or expanded U.S. capacity, while nearly 66% say they would invest more if the process were faster and more predictable.”
What’s in it: The Unlock American Energy and Jobs Act aims to address four “chokepoints”:
- Clean Water Act reform
- Liquefied natural gas export deregulation
- Nuclear licensing modernization
- National Environmental Policy Act litigation reform
Our view: “Permitting reform is essential to America’s manufacturing competitiveness—and today’s broken system is costing manufacturers more than $8 billion each year,” said NAM President and CEO Jay Timmons.
- “We are grateful for Sen. McCormick’s leadership in introducing the Unlock American Energy and Jobs Act. Modernizing the Clean Water Act, reforming judicial review under NEPA for all projects, ensuring durable support for U.S. LNG exports and bringing new nuclear power online are all critical steps toward a policy framework that will drive investment, power growth and keep manufacturing strong in America for decades to come.”
NVIDIA and Corning Partner to Expand U.S. AI Manufacturing

North Carolina and Texas are set to land major new manufacturing investments as chipmaker NVIDIA and glassmaker Corning expand U.S. production of critical AI infrastructure components—moves expected to create thousands of manufacturing jobs.
What’s going on: NVIDIA and Corning are partnering to build three advanced manufacturing facilities in North Carolina and Texas focused on optical connectivity technologies critical to AI infrastructure. The technologies use high-performance optical fiber that moves data to, from and inside AI data servers exponentially faster than copper wires. The expansion is expected to create more than 3,000 manufacturing jobs and increase Corning’s U.S. optical manufacturing capacity tenfold, the companies announced this week (CNBC).
- The announcement reflects the staggering scale of the AI buildout underway—and the increasingly central role manufacturers will play powering it.
- On CNBC’s “Mad Money,” NVIDIA Founder, President and CEO Jensen Huang called AI infrastructure “the single largest infrastructure buildout in human history,” saying the partnership represents an opportunity “to reinvest [and] revitalize American manufacturing for the first time in several generations” while also helping “revitalize the energy grid” (CNBC).
- Corning Chairman and CEO Wendell Weeks framed the effort as part of a broader push to strengthen domestic manufacturing and innovation, saying the partnership is about “inventing the future of computing with advanced optical technologies [and], most importantly, building on the tradition of Made in America.”
AI and jobs: Huang also pushed back against claims that AI will eliminate jobs, arguing the technology is already creating jobs—from chips and packaging to computer manufacturing. “It’s creating tons of jobs at the chips level for the first time.”
- “Every one of those manufacturing jobs creates six other jobs that support them,” Huang said.
- His takeaway: AI is creating jobs. “People who are experts in AI are highly sought after. AI is not going to take your job. Someone who is an expert in AI will compete for your job,” said Huang.
- Weeks compared AI to the rise of the internet, saying, “the [i]nternet was also a significant major changing type of event, but it wasn’t fundamentally about shifting physical infrastructure like AI is,” noting that both were transformational, “which makes people say any transformational technology goes through cycles[…]. I’ve never seen anything like what the world is building for AI infrastructure.”
Looking ahead: Weeks said Corning wants to work with “innovators who help,” adding, “[w]e are technical first [and] they’re great technologists at NVIDIA, and they help us see the future so we can help them make that future be real.”
Timmons, Streeter Among D.C.’s Most Influential People
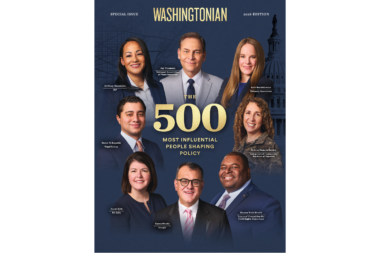
Washingtonian magazine has named NAM President and CEO Jay Timmons—who also appeared on the cover of this year’s issue—and NAM Executive Vice President Erin Streeter as among the most influential people in Washington, D.C., in 2026 (Washingtonian).
- The closely watched list, released every year, includes advocacy leaders and other experts shaping policy debates in the nation’s capital.
Timmons’ leadership: Washingtonian notes Timmons’ success in leading the NAM’s advocacy for tax reform, securing landmark legislation in 2017 that promoted manufacturing growth across the U.S. Timmons answered questions for the magazine article:
- First jobs: “Taking care of cattle on our farm in Ohio and cleaning bathrooms at a fast-food restaurant.”
- Best career advice he received: “Be authentic.”
- Most cherished possession: “A pothos plant given to my grandparents 70 years ago.”
- A hard-earned lesson early on [in print issue only]: “One early lesson that’s stayed with me is from back home in Chillicothe, Ohio. My grandfather stood in line for six months during the Depression just to get a job in manufacturing because he knew it would provide for his family—that taught me very young that work has purpose beyond the paycheck. It taught me that manufacturing builds opportunity and creates dignity and that belief has shaped everything I’ve done in Washington and at the NAM.”
Streeter’s leadership: Washingtonian also highlighted Streeter’s leadership in securing pro-growth tax policies for manufacturers, including the 2025 law that made permanent many of the measures in the 2017 legislation. Streeter answered her own set of questions:
- Hometown: “Hiawatha, Kansas.”
- Best career advice she ever received: “No job is beneath you.”
- What she’d tell her 18-year-old self: “Surround yourself with people with diverse backgrounds and experiences.”
The MI Talks Tech, Safety and Jobs at the AI for the Economy Forum

The manufacturing skilled talent shortage is likely to worsen before it gets better, Manufacturing Institute President Carolyn Lee said at Google and MIT’s recent AI for the Economy Forum in Washington, D.C.
What’s going on: Lee was on the panel “Industry Case Study: AI Adoption in Manufacturing,” moderated by Day 2 Media Founder and CEO Poppy Harlow, to discuss the impact of artificial intelligence on manufacturing.
- “[Here’s] the challenge we have in manufacturing on the talent front … by 2033, we’ll need to fill 3.8 million jobs,” Lee said. “Think about all of the [manufacturer investment] announcements that have come. … We think that number is only going to go higher.”
- While AI will help workers do their jobs, Lee continued, “we [will] still need a whole lot of skilled people at the center.”
Critical to growth: While manufacturers were some of the first in AI adoption, there’s been a change of late, Lee told Harlow. Manufacturers now “see that while AI is critical to the growth of their business,” some 82% “are saying that their people don’t have the skills necessary to put it fully to work.”
- “[R]ight now, we aren’t ready,” Lee went on. “We don’t have the change systems in place and the skills and the people in place. … [P]eople are really still at the heart of it.”
How it will help: AI will be instrumental in improving worker safety, Lee said.
- “[I]t will be able to, with vision systems, scan to say, ‘OK, you are too close to this machinery, this swinging distance, this forklift, this [personal protective equipment] isn’t in place, the safety systems are not in place.’”
Part of a trusted culture: Rather than take people’s jobs, as has long been feared, AI will also be able to aid in attracting and retaining workers, Lee said.
- If “you have a trusted culture where then workers can say, ‘Oh, you’re bringing in technology that’s going to make my job better, safer and improved,’ it helps feed [the notion that you’re a desirable employer], and then it will continue to grow.”
Perceptions of manufacturing: Public perceptions of the manufacturing sector have changed for the better since the global pandemic, according to Lee.
- Prior to COVID-19, about 27% of parents said they would encourage their children to pursue careers in manufacturing. That figure is now at 49%, she said.
Parting words: But manufacturing isn’t just one type of career; it has something for everyone.
- “This is my main message when I’m out talking about this,” Lee said. “We need to make sure that people are getting the skills they need for the jobs they want. We need to show them what those paths are.”