
Q&A with Sen. Young on R&D Expensing

NAM: Sen. Young, H.R. 1 restored immediate domestic R&D expensing, ending the amortization requirement that had been in effect since 2022. You have been one of the Senate’s most dedicated champions of R&D competitiveness through the American Innovation and Jobs Act. How did your years of sustained advocacy help deliver this outcome in the final reconciliation package?
Sen. Young: The American Innovation and Jobs Act laid the foundation for a multiyear, bipartisan effort to restore full and immediate expensing. From the outset, our goal was to make clear that strong R&D incentives are essential to maintaining America’s competitive edge. With the support of my Senate Finance Committee colleagues and active industry partners like the NAM, we built a broad coalition that understood the real-world consequences of the amortization treatment. This sustained advocacy was critical to ensuring this policy was included in the final version of the One Big Beautiful Bill Act.
NAM: The amortization requirement that was in effect from 2022 to 2024 was particularly damaging for manufacturers, who conduct 52% of private-sector research. Now that immediate expensing is restored and prior-year costs can be accelerated, what are Indiana manufacturers or other stakeholders telling you about how this relief changes their investment and hiring plans?
Sen. Young: During the three-year span when businesses had to amortize, I heard from countless Hoosier employers, including many in the manufacturing and life sciences industries, about how the R&D tax treatment was forcing incredibly difficult decisions. These included delaying R&D projects, scaling back hiring for key personnel like engineers and scientists and, in some cases, even considering shifting research activity overseas. That kind of uncertainty is especially challenging for industries that rely on long-term investment cycles.
Now that immediate expensing has been restored, and restored on a permanent basis, there is a renewed sense of confidence. Businesses back home have shared with me that they are moving forward with previously delayed investments, expanding their research operations and accelerating plans to grow their workforce. Those are the types of business decisions we should be encouraging in our tax code.
NAM: Restoring R&D expensing is a major step, but the United States still trails competitors like China in the overall generosity of R&D incentives. What is your honest assessment of where America now stands in the global innovation competition, and what further actions—whether through additional tax policy, increased federal R&D investment or streamlined regulatory pathways—should Congress prioritize to ensure the U.S. remains the world’s leading destination for manufacturing innovation?
Sen. Young: As our global competitors, like China, are expanding their R&D incentives, we simply cannot allow our nation and our economy to fall behind. To remain the world’s leading destination for innovation and advanced manufacturing, we need a more comprehensive approach. That includes increasing federal investment in critical research areas, ensuring our regulatory environment supports the commercialization of new technologies and strengthening workforce development and apprenticeship streams so that we can better connect students and workers to high-demand careers in manufacturing and innovation.
My focus going forward is on advancing policies that not only restore our competitiveness but position the United States to lead in rapidly growing industries like advanced manufacturing, artificial intelligence, quantum and biotechnology.
NAM: Thank you, Sen. Young. What can NAM members do to help manufacturers take advantage of the restored R&D deduction and to support continued investment in American manufacturing innovation?
Sen. Young: I would encourage NAM members to continue engaging with policymakers and sharing examples of how R&D incentives are driving investment, hiring and innovation in their communities. Those real-world stories about the advancements companies are making are incredibly important as we consider future policy decisions.
I’d also urge manufacturers to fully utilize the restored deduction and continue investing in their workforce and research capabilities. By doing so, and by staying engaged in the policymaking process, you can help ensure we build on this progress and continue strengthening America’s leadership in manufacturing.
Manufacturers Turn to Second Chance Hiring to Access Talent

As workforce shortages persist, some manufacturers have turned to hiring of individuals who have been involved in the justice system—called second chance hiring—as a practical solution to fill critical roles and improve retention.
In recognition of Second Chance Awareness Month, the Manufacturing Institute—the workforce development and education affiliate of the NAM—convened leaders from Toyotetsu Texas and JBM Packaging to discuss what it really takes for second chance hiring programs to succeed.
- This virtual discussion was part of the MI’s monthly Solution Series, which offers manufacturers timely, high-impact, actionable insights to address workforce challenges.
The business case: For TTTX and JBM Packaging, second chance hiring does more than just help their communities—it’s a strategic response to a business need. Justice-impacted individuals are an often-overlooked talent population who tend to demonstrate strong loyalty and long-term commitment to employers who give them a chance. Their high engagement and motivation to succeed can impact their shop floor culture positively.
- “We started [second] chance hiring because we had more work than we had workers,” said JBM Packaging Leader of Learning and Development Jacqueline Cooley. “We were looking for a way to get people in the door, to keep people [and] to produce the packaging we need.”
- Today, 46% of JBM Packaging’s workforce is second chance hires, and their turnover rate sits at approximately 13–14%—well below the manufacturing industry average.
- TTTX also attributes low turnover rates to strategic investment in second chance hiring.
More than just filling jobs: Many justice-impacted individuals face barriers like financial, housing and transportation insecurity, which can prevent even the most motivated hires from succeeding at work. Both TTTX and JBM Packaging built their second chance programs to address those challenges.
- TTTX created a carpool program for employees without transportation and provides basic job essentials like steel-toed boots. They also implemented a mentorship system to help new justice-impacted employees acclimate.
- JBM Packaging enrolls new second chance hires in its Better Lives program, a year-long holistic program that includes financial and life coaching, in-house loans, access to a vehicle and wellness resources.
- “We’re not focused on just hiring individuals. We’re focused on building a system—having a comprehensive, holistic approach—making sure that we are setting up these individuals for success, because in the long run, when they’re successful, our organization is going to be successful,” said TTTX Vice President of Administration Leslie Cantu.
A second chance in action: Don Christian is one of the most powerful examples of what second chance hiring can accomplish. After more than 20 years of incarceration, Christian learned of TTTX from his parole officer in 2018 and became one of the first individuals hired through the program. His enthusiasm, dedication and positive impact on the plant floor helped TTTX successfully pilot and continue its second chance program.
- Today, Christian serves as a peer mentor at TTTX, helping new hires navigating similar challenges. He is also enrolled at San Antonio College, pursuing a degree in life coaching and social work with the goal of paying his opportunity forward.
- “I [had] never had a job in my life. I had no experience, but I gave it a shot. When I got [to TTTX], it changed my life. It gave me a chance to reshape my life,” said Christian.
- To other second chance hires, Christian has the following advice: “Now you’re given a second chance. Show them what you got. Show them what you can do.”
Next steps: The MI offers additional second chance hiring resources on its website, including an employer toolkit. The toolkit outlines the five major steps of building and launching a second chance hiring initiative: Plan, Partner, Equip, Implement and Sustain.
- As mentioned above, the MI explores solutions like second chance hiring every month in its Solution Series, which you can sign up for via the MI’s Solutions Center.
- May’s Solution Series event will feature the ins and outs of planning and delivering a successful MFG Day event that will help inspire the next generation of the manufacturing workforce. Learn more and register here.
This Leader Is Building a More Accessible Future for Manufacturing
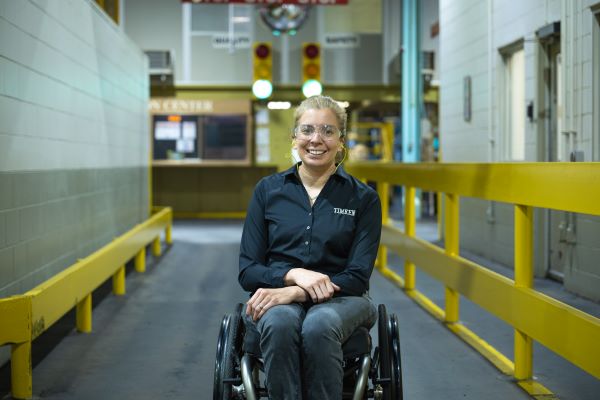
Michelle Barnhart knows firsthand that disabled workers can thrive in and contribute to manufacturing firms—she is living proof of it.
Not only did manufacturing give her a first shot at a rewarding career as a high school grad, but it gave her another opportunity for success after an injury off the job left her paralyzed.
- “I often say that manufacturing saved me multiple times throughout my life,” Barnhart reflected.
Finding her path: After graduating from high school, Barnhart didn’t see a clear path forward. Through a local unemployment office, she was placed as a second shift contingent worker at a local ink manufacturer.
- What could have been a temporary role quickly became a permanent pathway as she found herself thriving on the shop floor. Over time, she moved up the ranks to become a first shift team lead.
An unforeseen change: Years into her career, Barnhart’s life changed in an instant. An injury in her personal life left her paralyzed and confined to a wheelchair, facing an uncertain future.
- But her company supported her, helping her transition into an order entry and customer service role so she could stay in the industry she loved.
A career shift: But the manufacturing floor kept calling. While searching for a job where her wheelchair was not a barrier to shop floor operations, she found The Timken Company, a global technology leader in engineered bearings and industrial motion.
- Though she started as a floor supervisor at Timken’s Keene, New Hampshire, facility, Barnhart soon switched to a role in human resources, a decision shaped by the support she received from her employer’s HR team after her injury.
- Now in her 10th year at Timken, she serves as HR manager at the company’s Lincolnton, North Carolina, bearing plant.
A recognized leader: Barnhart’s outstanding leadership at Timken earned her recognition as a 2026 STEP Ahead Emerging Leader by the Manufacturing Institute, the NAM’s workforce development and education affiliate.
- The awards honor 145 outstanding leaders in manufacturing, from the shop floor to the C-suite, who are helping the next generation see themselves in modern manufacturing careers.
Leading with inclusion: Barnhart’s leadership at Timken has included establishing the Celebrating Abilities Network, a grassroots employee resource group at Timken that supports individuals with physical and mental disabilities, as well as caregivers, through informational and intersectional programming.
- In 2025, CAN reached more than 475 Timken employees across the U.S.
- “Inclusion drives performance. It really is a pretty simple formula,” said Barnhart. “When people feel valued, when people feel supported, they’re more engaged. When they’re more engaged, they’re more innovative. When they’re more innovative, they’re more committed. And this directly ties back to safety, quality [and] delivery.”
The next generation: A devoted mentor of many younger employees over the years, and one grateful to her own set of guides, Barnhart is going further in supporting the next generation of manufacturing workers by pursuing a Ph.D. at Capella University.
- Her research focuses on the barriers to manufacturing employment for people with physical disabilities from the perspective of frontline supervisors.
- “We’re trying to come up with unique or creative ways to fill [open manufacturing] roles. Certainly we need to be looking into the disability population, as that is one of the higher unemployment rates across the U.S.,” said Barnhart.
The last word: “If you do not see yourself reflected in this industry, that is the exact reason why you need to join. You belong here. We want you here,” said Barnhart. “Give it a chance and see if it can save your life as it did for me two times over now.”
Tenth District Factories Stay in Expansion Territory Despite Input Costs Climbing
Manufacturing activity grew at a slightly slower pace in the Tenth District in April, with the month-over-month composite index edging down to 10 in April from 11 in March. On the other hand, expectations for future activity improved 2 points to 18. The month-over-month activity loss was due to a decline in durable manufacturing, while nondurable manufacturing activity increased further. At the same time, all indexes except new orders for exports were positive in April. The Tenth Federal Reserve District encompasses the western third of Missouri; all of Kansas, Colorado, Nebraska, Oklahoma and Wyoming; and the northern half of New Mexico.
The production and shipments indexes both declined but remained positive, decreasing from 11 to 10 and from 20 to 15, respectively. Meanwhile, new orders fell from 15 to 12. The employment index moved down 5 points to 2. At the same time, the pace of growth for prices paid and prices received strengthened, with raw materials prices jumping 26 points to 63 and prices received rising 6 points to 25. Furthermore, the indexes for prices received and paid both increased over the year, moving up to 57 and 88, respectively.
In April, survey respondents were asked special questions about changes in energy costs and the ability to pass through energy-related costs. Overall, 93% of firms reported that they have experienced higher transportation costs in the last two months, 43% saw higher natural gas costs and 38% noted higher electricity costs. Furthermore, over two-thirds of firms that have experienced higher energy costs said they will pass on 0% to 20% of those costs to customers, 3% will pass on 21% to 40%, 8% will pass through 41% to 60%, 4% will pass on 61% to 80% and 8% will pass on 81% to 100%. Meanwhile, 6% of firms have had to decrease prices.
Flash Manufacturing PMI Hits a Four-Year High as Domestic Demand Strenghtens
The S&P Global Flash U.S. Manufacturing PMI increased from 52.3 to 54.0 in April, a 47-month high. This continues the trend of nine consecutive months of growth. Factory production and new order growth improved in April, with both experiencing their strongest expansion since 2022. Meanwhile, export orders declined after stagnating the prior month as a result of uncertainty caused by the conflict in the Middle East.
Inventories grew marginally in April as companies continued to purchase safety stock amid delivery concerns. At the same time, supplier delivery time lengthened to the greatest extent since August 2022, with respondents attributing the increase to the conflict in the Middle East. Manufacturers’ input cost inflation rose to a ten-month high and at the second fastest rate since July 2022. Meanwhile, selling price inflation also moved up, resulting in the largest jump in average selling prices since July 2022. Overall, price increases accelerated for manufacturers and the service industry.
Overall business activity rose to a three-month high, stepping up from 50.3 in March to 52.0 in April. While manufacturing growth accelerated, the services sector rose only slightly, moving to a two-month high. Overall, growth of new orders accelerated, driven by domestic demand as export orders fell at an increased rate. Employment grew marginally as manufacturing headcounts fell for the first time in nine months.
Furthermore, optimism about future business conditions improved in April, with manufacturers’ optimism rising to the highest level in over a year. The optimism reflected manufacturers’ upturn in orders, additional investment in marketing and hopes of reshoring. In addition, the outlook for service providers remained low as war-related concerns further exacerbated cost-of-living concerns.
Manufacturers Back Long-Awaited Federal Action on Data Privacy
House Energy and Commerce Bill Would Protect Consumers and Clarify Rules so Manufacturers Can Continue to Innovate, Compete
Washington, D.C. – Manufacturers today welcomed the introduction of the SECURE Data Act by House Energy and Commerce Committee Chairman Brett Guthrie (R-KY) and Vice Chair John Joyce (R-PA).
National Association of Manufacturers Executive Vice President Erin Streeter issued the following statement endorsing the SECURE Data Act:
“Processing personal data has become integral to modern manufacturing operations and modern manufactured products. Manufacturers are encouraged that this first-of-its-kind federal law would establish a uniform national framework that is both forward-looking and adaptable to new technology, while avoiding the regulatory morass of a 50-state patchwork. Manufacturers believe granting consumers much-needed privacy protections and creating clear guidelines will keep the industry innovating and competing in the age of AI. We thank Chairman Guthrie and Vice Chair Joyce for championing this legislation.”
-NAM-
The National Association of Manufacturers is the largest manufacturing association in the United States, representing small and large manufacturers in every industrial sector and in all 50 states. Manufacturing employs nearly 13 million men and women, contributes $2.95 trillion to the U.S. economy annually and accounts for nearly 52% of private-sector research and development. The NAM is the powerful voice of the manufacturing community and the leading advocate for a policy agenda that helps manufacturers compete in the global economy and create jobs across the United States. For more information about the NAM or to follow us on Twitter and Facebook, please visit www.nam.org.
733 10th St. NW, Suite 700 • Washington, DC 20001 • (202) 637-3000
Small Business Optimism Drops Below Average as Uncertainty and Inflation Concerns Rise
The NFIB Small Business Optimism Index stepped down 3 points to 95.8 in March, falling below the 52-year average of 98.0. March’s decrease was due primarily to a decline in earnings trends and expected business conditions. Of the 10 components included in the index, eight decreased and two stayed the same. Meanwhile, the Uncertainty Index rose 4 points to 92, still well above the 51-year average (68) and above the average since 2016 (80).
Taxes were again cited as the top concern for small business owners, with 19% reporting them as the most important problem, unchanged from February. The share of business owners reporting labor quality as the top problem stayed the same in March at 15%, with 32% struggling to fill open jobs and 52% reported hiring or trying to hire in March. Meanwhile, inflation ranked third in the list of concerns, with 14% reporting it as their top problem, up 2 points from February, with a net 25% raising prices.
A net 33% of small business owners reported raising compensation, down 1 point in March after moving up 2 points in February. Meanwhile, 18% of business owners plan to increase compensation in the next three months, down 4 points from February and the lowest reading since July. Pressure on profitability strengthened in March, with positive profit trends falling 11 points from February to a net negative 25%. Among owners reporting lower profits, 32% blamed weaker sales, 19% mentioned usual seasonal changes, 10% cited increased material costs and 7% noted labor costs. Meanwhile, 5% reported their last loan was harder to get than previous attempts, unchanged from February, and a net negative 3% of owners cited paying a higher interest rate on their most recent loan, unchanged from the prior month.
The outlook for general business conditions fell 7 points to 11%, remaining above the historical average of 4%. Furthermore, expectations for better business conditions are down 10 points from March 2025. At the same time, 11% reported that it is a good time to expand their business, down 4 points from February and a rather weak reading compared to times of economic expansion. Overall, growth has slowed and uncertainty has risen, as small business owners anticipate worse conditions in the future.
Trade Costs Climb as Import and Export Prices Pick Up
U.S. import prices increased 0.8% in March, after rising 0.9% in February, with higher nonfuel and fuel prices driving the increase. Over the year, import prices advanced 2.1%, the largest 12-month increase since December 2024. Meanwhile, U.S. export prices climbed 1.6% in March, driven by higher prices for nonagricultural and agricultural exports. Over the past year, export prices rose 5.6%, the largest over-the-year increase since November 2022.
In March, U.S. import prices for manufacturing rose 2.8% over the year, as most of the industry experienced price increases. Primary metal manufacturing experienced the most significant over-the-year U.S. import price increase in March, surging 35.1%. On the other hand, the greatest yearly decline in U.S. import prices occurred in beverage and tobacco product manufacturing, which fell 12.1% from March 2025. Meanwhile, U.S. export prices for manufacturing in March advanced 4.9% over the year, with primary metal manufacturing export prices exhibiting the largest rise (39.1%).
Fuel import prices climbed 2.9% in March, the largest monthly rise since January 2025, after increasing 2.4% in February. Higher prices for petroleum more than offset lower prices for natural gas. Import prices for petroleum and petroleum products climbed 9.4% in March. However, prices for fuel imports fell 6.0% from March 2025. At the same time, natural gas prices plummeted 71.0% in March and 49.8% over the year.
Nonfuel import prices increased 0.6% in March, after advancing 0.8% in February. Higher prices for nonfuel industrial supplies and materials, capital goods, consumer goods and foods, feeds and beverages drove the increase. The price index grew 2.8% over the past year, the largest over-the-year gain since October 2022.
After moving up 0.9% in February, agricultural export prices rose by a similar amount in March. Over the past 12 months, agricultural exports advanced 3.4%. Meanwhile, nonagricultural exports stepped up 1.7% in March. Higher prices for nonagricultural industrial supplies and materials more than offset lower prices for capital and consumer goods. Over the past year, nonagricultural export prices climbed 5.8%.
New York Factory Activity Rebounds as Orders and Shipments Hit Their Strongest Pace Since 2023
Manufacturing activity in New York state expanded in April, with the headline business conditions index rising 11.2 points to 11.0. The new orders index increased 12.9 points to 19.3, while the shipments index soared 27.1 points to 20.2, the highest level for both indexes since 2023. Unfilled orders decreased 1.7 points to 9.1, while inventories moved down 1.8 points to 5.1, indicating business inventories are growing but at a slower pace. Delivery times shortened, ticking down 1.6 points to 12.1, and supply availability worsened, declining 6.2 points to -10.1.
Employment increased in April, with the index for the number of employees rising 4.0 points to 9.8. At the same time, the average employee workweek jumped to 13.7 from 1.9, signaling a significant increase in hours worked in April. The prices paid index rose 14.4 points to 51.0, while the prices received index edged up 0.4 points to 21.8, reflecting a faster pace of increase in both prices paid and prices received.
In April, firms’ optimism regarding the future declined but remained positive, with the future business activity index falling 11.4 points to 19.6. In the next six months, new orders are expected to rise but at a slower pace compared to the prior month at 24.8. The future employment index moved down 4.1 points to 18.1, suggesting an anticipated slower pace of employment growth over the next six months. Meanwhile, input and selling price expectations are forecasted to increase at a faster pace, rising from 43.1 to 61.6 and from 32.4 to 38.6, respectively. Furthermore, capital spending plans weakened in April, falling from 21.6 to 13.1.
Philly Manufacturing Survey Signals Stronger Momentum as Orders and Shipments Increase
In April, Philadelphia’s regional manufacturing activity expanded for the fourth consecutive month, with the index for general business activity advancing from 18.1 to 26.7. This month, 32.6% of firms reported increases in activity, while only 5.9% noted decreases. The index for new orders jumped from 8.6 to 33.0, while the shipments index climbed 11.8 points to 34.0. Meanwhile, the employment index turned negative, falling 5.9 points to -5.1, and the average employee workweek index moved up from 2.8 to 7.7.
The prices paid and prices received indexes both rose in April, increasing from 44.7 to 59.3 and from 21.2 to 33.5, respectively. As has been the case for many months, the prices received index remained lower than the prices paid index, indicating that manufacturers have been absorbing a portion of higher costs paid.
Looking ahead, most indicators showing future expectations for growth declined but remain elevated. After falling 2.8 points in March, expectations for future business activity ticked up 0.8 points to 40.8 in April. The gain came from a decline in the proportion of firms expecting a decrease in activity (15.7%). At the same time, the proportion of firms expecting an increase in activity (56.5%) moved up in April. The future new orders index dropped from 49.6 to 45.7, while the capital expenditures index climbed from 25.8 to 35.2. The future prices paid index dipped from 53.7 to 50.2, while the future prices received index rose from 38.4 to 50.2. Additionally, the index for future employment moved down from 40.4 to 35.9.
In April, firms were asked about changes in wage rates and compensation packages as well as expectations for input and labor costs. Of those responses, 46.2% of firms indicated wage rates and compensation costs have increased over the past three months, 53.8% reported no change and no firms indicated a decrease during that time. When asked about input and labor costs, firms expect higher energy costs (up 5% to 7.5%), higher cost of health benefits (up 4% to 5%) and smaller increases in other categories. Notably, 19.2% of respondents anticipate both energy and health benefits costs to rise by more than 12.5% during 2026.