
Economic Data and Growth
Manufacturing Expands for Eighth Consecutive Month
September 8, 2026In August, the U.S. manufacturing sector expanded for the eighth consecutive month but at a slightly slower pace, with the ISM Manufacturing® PMI edging down 1.0 percentage point to 54.6%. Certain demand indicators, such as the New Orders, Backlog of Orders and New Export Orders indices, were in expansion, while the Customers’ Inventories Index remained…
Manufacturing PMI Holds Steady as Backlogs and Hiring Build
September 8, 2026The S&P Global Manufacturing PMI was 53.9 in August, unchanged from July. Production rose at the weakest rate since February, while new orders continued to grow at a pace similar to July. At the same time, employment rose at the fastest pace of the year as optimism increased to a three-month high. The growth in…
Global Manufacturing Edges Higher as Employment Growth Hits Three-Year High
September 8, 2026In August, growth in global manufacturing strengthened slightly from July, ticking up from 52.1 to 52.3. Output and new orders both improved at faster paces than the prior month. Meanwhile, lead times lengthened, but the rate of increase eased to the lowest level since March. Employment rose at the quickest pace in three years while…
Payrolls Beat Expectations, with Manufacturing Adding 16,000 Jobs
September 8, 2026Nonfarm payroll employment increased by 162,000 in August, coming in above expectations. Meanwhile, June’s job gain was revised upward by 11,000 to 31,000 jobs, while July’s job loss was revised upward by 44,000 to a gain of 21,000 jobs. The 12-month average stands at 50,250 job gains per month. Leisure and hospitality exhibited the largest…
Manufacturing Job Openings Rise Sharply, Led by Durable Goods Demand
September 8, 2026Job openings for manufacturing increased by 79,000 to 580,000 in July. At the same time, the June job openings level of 501,000 was revised upward from 481,000 in the previous report. Durable goods openings in July jumped 76,000 to 429,000, while nondurable goods openings ticked up 2,000 to 151,000. The manufacturing job openings rate rose…
Texas Factory Activity Strengthens as Orders, Production and Outlook Improve
September 8, 2026In August, Texas factory activity expanded at a faster pace after strengthening the prior month. The production index increased from 10.1 to 16.1, remaining above the series average of 9.6. The new orders and capacity utilization indices both climbed above their series averages, rising from 6.4 to 22.0 and from 5.9 to 12.8, respectively. Meanwhile…
Factory Orders Regain Momentum, Led by Aircraft Demand
September 8, 2026New orders for manufactured goods increased 0.9% in July after inching down 0.2% in June. Meanwhile, new orders for manufactured goods rose 6.5% over the year. When excluding transportation, new orders moved up 0.6% over the month and climbed 6.9% year-over-year in July. Orders for durable goods stepped up 1.1%, after rising 0.6% in June.

Consumer Confidence Slips as Future Expectations Weaken
August 31, 2026Consumer confidence decreased 0.8 points in August to 89.4. Among its components, the Present Situation Index improved while the Expectations Index contracted as customers’ concerns regarding the present situation eased and concerns about the future worsened. The Present Situation Index, reflecting current business and labor market conditions, rose 6.8 points to 121.2. Meanwhile, the Expectations…
Fifth District Factory Growth Eases, While Investment Outlook Improves
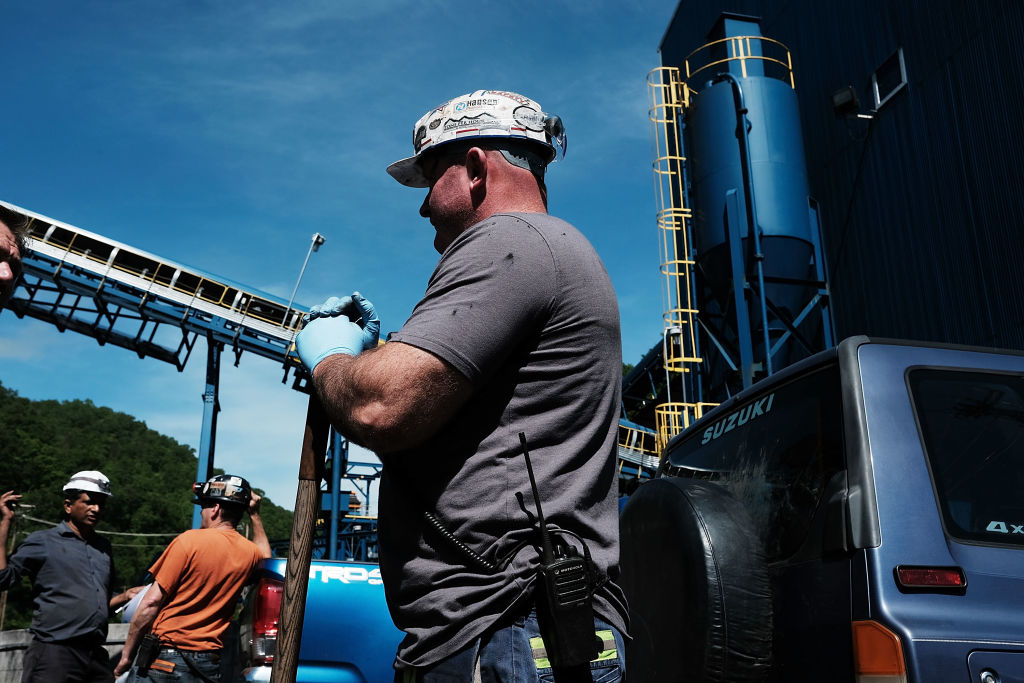
August 31, 2026Manufacturing activity in the Fifth District rose at a slower pace in August after ticking up in July, with the composite manufacturing index edging down from 5 to 4. At the same time, local business conditions stepped down but remained positive, declining from 10 to 4 in August. In line with a weakening of business…
Home Prices Gain Momentum, but Affordability Still Limits Demand
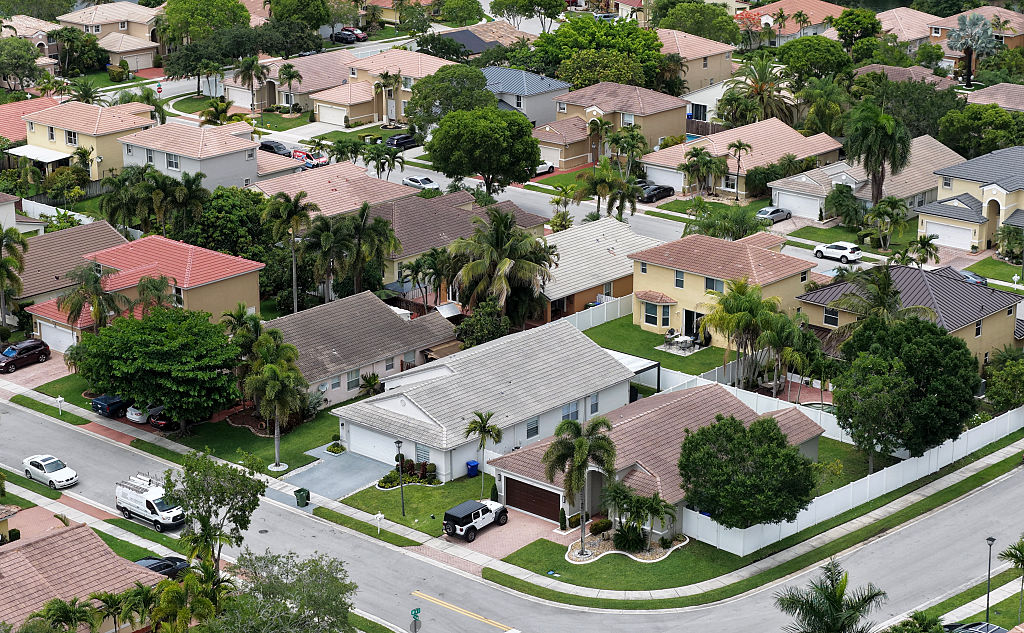
August 31, 2026In June, the S&P Cotality Case-Shiller U.S. National Home Price Index recorded a 1.5% annual gain, up from a 1.2% rise in May. The 10-City Composite increased 2.9% year-over-year, up from a 2.4% gain the previous month, while the 20-City Composite moved up 2.1%, up from 1.6% in May. Chicago again posted the highest annual…
